
Which Blood Pressure Reading Is the Real One?
Inside this episode
The video’s narration, chapter by chapter, with stills from the video and every source at the end.
The short version
No single reading is his real blood pressure. Every cuff reading is an estimate, and readings move by several points even within one sitting. The closest thing to a real number is an average from one validated, meaning independently tested for accuracy, upper-arm monitor: morning and evening, for about a week, every reading kept. By our reasoning, his two sets of numbers can't prove which is right, because too much changed at once. Cold really does push readings up, and so can stress in the moment. We found no study of a climbing display as such, but he told us it stressed him out, so our best explanation is a mix: the two monitors' own difference, that stress, the cold room, and ordinary scatter. One reading in the 150s isn't a diagnosis; it's a reason to measure properly. And the risk tools doctors use multiply blood pressure and cholesterol rather than adding them, by our reading of how they work, so an overall risk estimate matters more than any one number.
No single reading is real
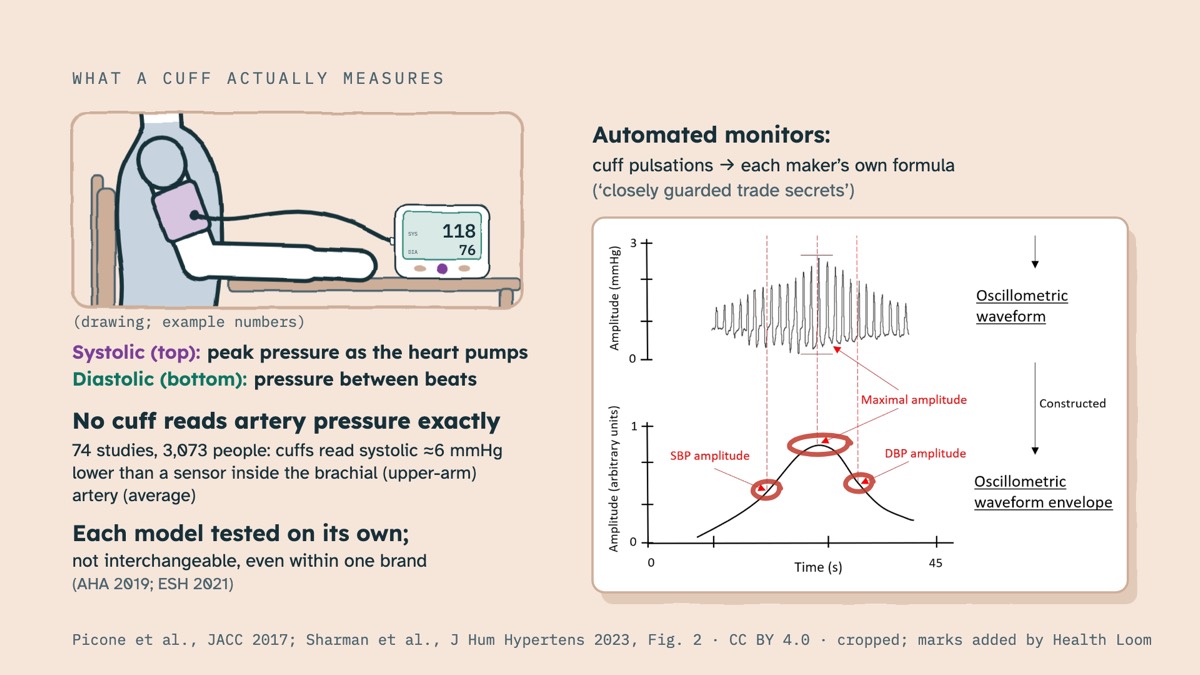
Two terms first. The top number, systolic, is the peak pressure in your arteries as the heart pumps; the bottom number, diastolic, is the pressure between beats. No cuff, at home or in the clinic, reads the pressure inside the artery exactly. Across 74 studies comparing cuffs with a sensor inside the arm's main artery, cuffs read the top number about 6 points lower, on average. Automated home monitors sense tiny pulsations in the cuff, and turn them into numbers with a formula. Those formulas are closely guarded trade secrets. So American and European experts say each model must be tested on its own; one model's accuracy tells you nothing about another, even from the same brand.
Then there's scatter. Your pressure shifts from minute to minute. In 111 healthy volunteers, repeat readings at rest varied by about 4 points. In a US national survey, for one adult in five, three readings in a row had a statistical spread of 5 points or more. From day to day, home systolic wandered by about 7 points in a study of Japanese winter homes. And in US veterans, mostly men with long-standing, poorly controlled hypertension, the medical word for high blood pressure, a single clinic systolic anywhere from 120 to 157 couldn't show, with 80 percent confidence, whether their pressure was controlled. Averaging five or six readings fixed most of that. That's why the American Heart Association asks clinicians to tell patients that single readings may vary greatly.
So what is real? The closest thing is an average, taken by a set routine. The American Heart Association asks for two readings at least a minute apart, morning and evening, ideally for seven days and at least three, then an average of them all. European experts ask for much the same. Japan's 2019 guideline, since updated, asks for every reading to be recorded, without picking and choosing. Averages aren't just tidier. In a US study of about 400 untreated adults around 40, mostly with normal pressure, a week of home readings was more repeatable than three clinic visits, though it was judged against heart-muscle thickness, not heart attacks or strokes. And in an observational study of English health records, averaging clinic readings gave somewhat stronger links with later disease than a single reading.
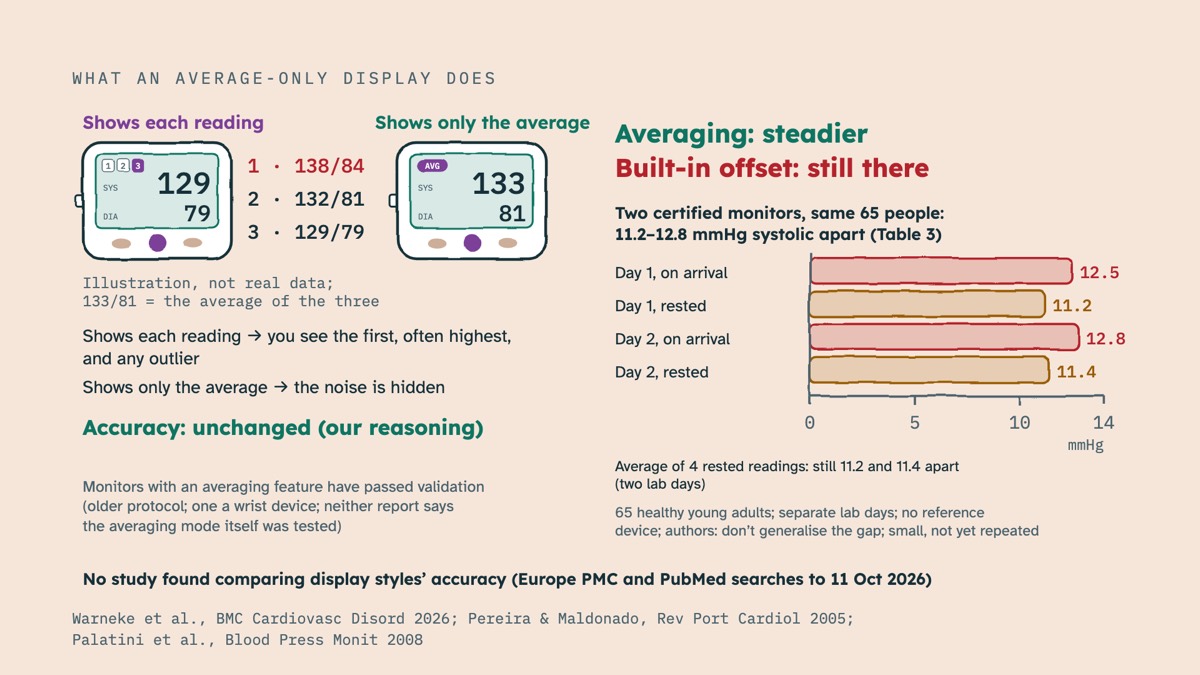
What about a monitor that shows only the average? Averaging smooths out random ups and downs, but it can't remove a monitor's built-in offset. In one small study of 65 healthy young adults, two certified monitors, used on separate lab days, differed by about 11 to 13 points systolic, and the gap stayed at about 11 even on the average of four rested readings. An average makes a monitor steadier, not necessarily more correct. Our reasoning on the display itself: showing each reading exposes the first, often highest, reading and any outlier; showing only the average hides them. That changes what you see, not how accurate the device is. And we found no study comparing the accuracy of the two display styles.
So what can our listener's two sets of numbers say? They're a few night-time readings on each monitor. Between the two sets, the monitor changed, the display changed, the warmth changed, from a cold room to warmer clothes, and the nights changed. Perhaps the arm and the timing did too. Add ordinary scatter, and there's no way to pull those apart. That's our reasoning, not a study's finding. But it means neither set can tell him which number is true, and it isn't a verdict on his health either way. The fix is standard, and we'll come to it: one validated monitor, one standard week, and a clinician's look.
What moves a reading
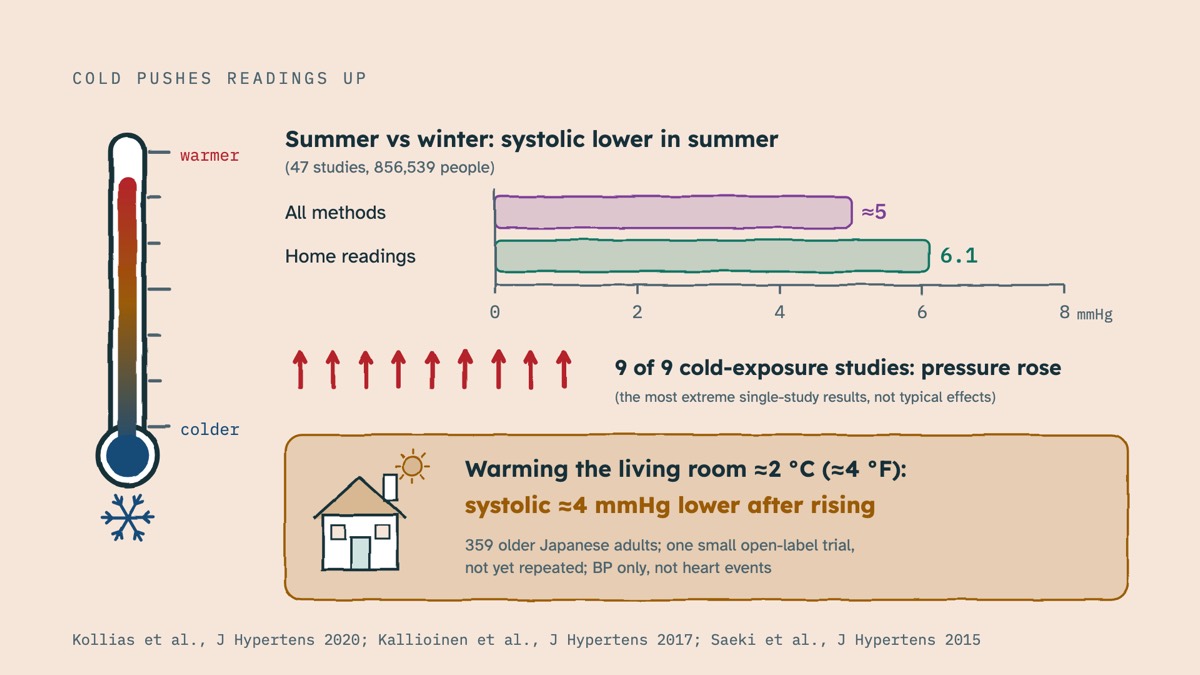
Start with cold, which has been studied a lot. Across 47 studies of more than 850,000 people, readings ran about 5 points systolic lower in summer than in winter, and about 6 for home readings. Every one of the nine cold-exposure studies in one large review found that cold pushed pressure up, though the biggest effects there were extreme lab results, not typical ones. Warming helps, too. In a randomised trial in 359 older Japanese adults, heating the living room by about 2 degrees Celsius lowered systolic in the hours after getting up by about 4 points. That was one small open-label trial, meaning people knew which group they were in; it hasn't been repeated, and it measured blood pressure, not heart attacks or strokes.
What about a cold room at home? Detailed data come from about 3,800 people in Japanese winter homes. Their morning readings averaged about 6 to 7 points above their bedtime readings. But most of that gap was the normal morning rise and bedtime habits. Only a little under one point per degree of overnight cooling tracked the room: about 3 points for the typical drop of about 3 degrees, by our arithmetic. Where the living room cooled 4 degrees or more overnight, the gap was about 9 points, against about 4 where it stayed within a degree. That's an observational study, part-funded by Japan's housing ministry, and several authors have ties to gas, home-building or monitor companies. Japan's 2019 guideline also warns that measuring in an unheated room in winter pushes readings up.
Two loose ends. Does a cold arm fool the cuff? We found no study testing that with upper-arm monitors; one small 2001 experiment in 14 people found arm cooling made two finger-based devices disagree by about 9 points. And clothing? Across 13 office studies, most of them small and at high risk of bias, a thin sleeve under the cuff made no meaningful difference. Still, the American Heart Association says the cuff goes on bare skin, without a rolled-up sleeve squeezing the arm. For our listener, by our reasoning, his cold-room and warmer-clothes readings fit the well-replicated pattern that colder conditions go with higher readings. But how many points his room added can't be measured from his readings, because the monitor changed at the same time.
Now the question our listener may care about most: does watching the numbers climb push the reading up? We found no study that tested it, for readings or for worry. The nearest evidence points both ways. In small studies from the 1980s, with a sensor inside the artery, a doctor walking in to take a reading raised systolic pressure by about 27 points on average within minutes, before it settled. With a nurse, the rise was about half as big. That's the alerting reaction: a jump in response to being measured. But in a small 1985 study of 22 people, the cuff squeezing the arm did not by itself raise pressure inside the artery. That study didn't test watching a display, and hasn't been repeated with modern monitors. But our listener told us the climbing numbers stressed him out, and stress during measurement does push readings up. So, by our reasoning, it most likely pushed some of his old-monitor readings up, especially the one in the 150s, taken while it stressed him.
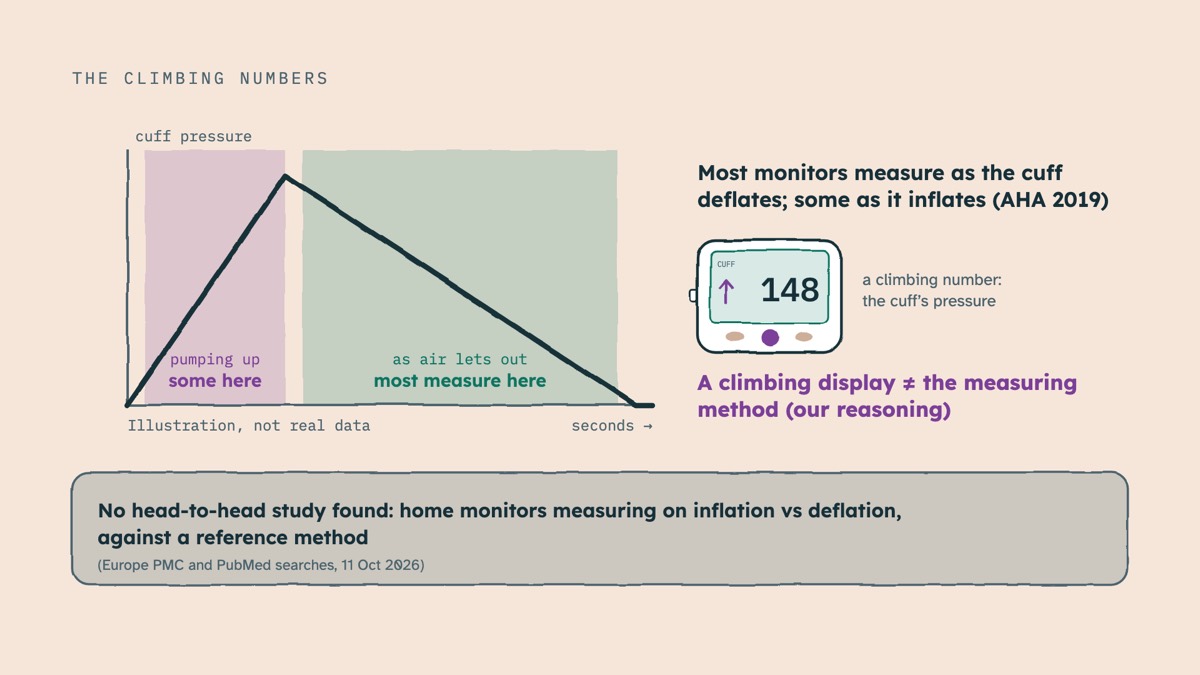
About those climbing numbers. Most monitors measure as the cuff lets air out; some measure as it pumps up. By our reasoning, a climbing display may just show the cuff's own pressure, and it doesn't reveal which method a monitor uses. We found no head-to-head study of home monitors comparing the two.
Worry matters in the moment, too. In an observational study of 238 patients at a blood pressure clinic, people whose pressure jumped there were more anxious at that moment, not more anxious in general. Checking your own pressure, though, didn't raise anxiety in UK trials of people already on treatment, who checked at their GP surgery, or at home about one week a month; one trial, part-funded by a monitor maker, reported only that it didn't differ. A large pregnancy trial found the same. But we found no trial in adults who aren't pregnant and don't have high blood pressure, and none of these tells us about checking every day. Some people describe panic over one bad number; those are personal accounts, not a measure of how common it is. And some experts suggest that people made anxious by home checks may do better with a 24-hour, or ambulatory, monitor, worn through a day and a night.
Time of day matters too. A bedtime reading is still an awake, seated reading, not your sleeping blood pressure, which usually falls during sleep, by about 10 to 20 percent in the textbook pattern. Only a 24-hour monitor, or a special home monitor that inflates automatically during sleep, can see that. Morning versus evening varies. In Finland, people with untreated high blood pressure read a few points higher in the evening. In Japan, mornings are usually higher, partly because bedtime readings there often come after a bath, a drink, or evening pills, as Japan's 2019 guideline, since updated, points out. And in a Finnish study with 162 cardiovascular events, morning and evening readings predicted heart problems equally well.
What you did beforehand counts as well. Readings run about 5 points lower for a few hours after exercise, on average across many varied studies. And in small trials in people with high blood pressure, two to three cups of coffee's worth of caffeine pushed readings up by about 8 points for at least three hours. Our listener's morning readings are lower on both monitors, in a warmer house. That fits the temperature evidence, but timing, activity and meals also differ between his mornings and nights. By our reasoning, the protocol's answer is simple: include both, every day of the measuring week, on one monitor.
Last, how a reading is taken. A review of more than 300 studies found almost every detail can nudge a reading, from a few points to over 30 in extreme cases. Some of the better-measured ones: in a Baltimore trial, a cuff one size too small pushed the top number up by about 3 to 10 points, depending on arm size. Resting the hand in the lap added about 4 points; letting the arm hang, about 6 and a half. Every centimetre the cuff sits below heart level adds a little under one point. And in people with high blood pressure, crossing the legs at the knee added up to about 8 to 10 points.
Office versus home
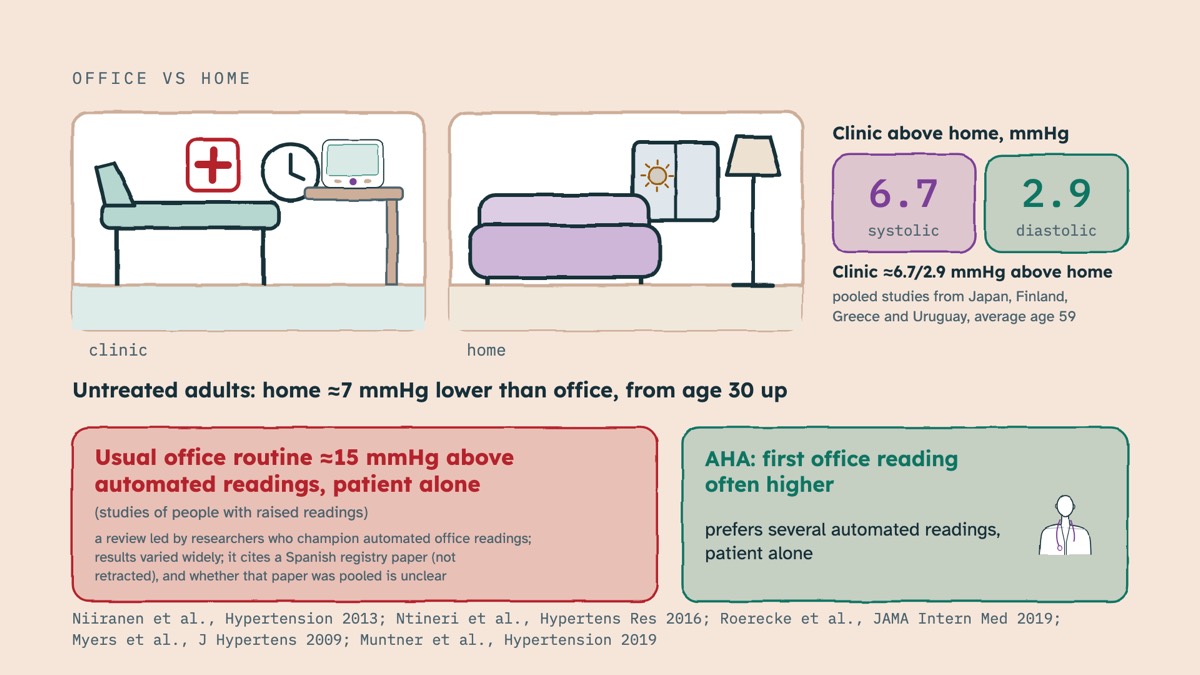
In pooled studies from Japan, Finland, Greece and Uruguay, average age 59, clinic readings averaged about 7 points systolic and 3 diastolic above home readings. Among untreated adults, home readings ran about 7 points lower than office readings from age 30 up. How the office measures matters a lot. In studies of people with raised readings, the usual office routine read about 15 points higher than automatic readings taken with the patient sitting alone. That review was led by researchers who champion the method, and its results varied a lot between studies. The first office reading is often higher than later ones, which is one reason the American Heart Association prefers several automatic readings, taken with the patient alone, and averaged.
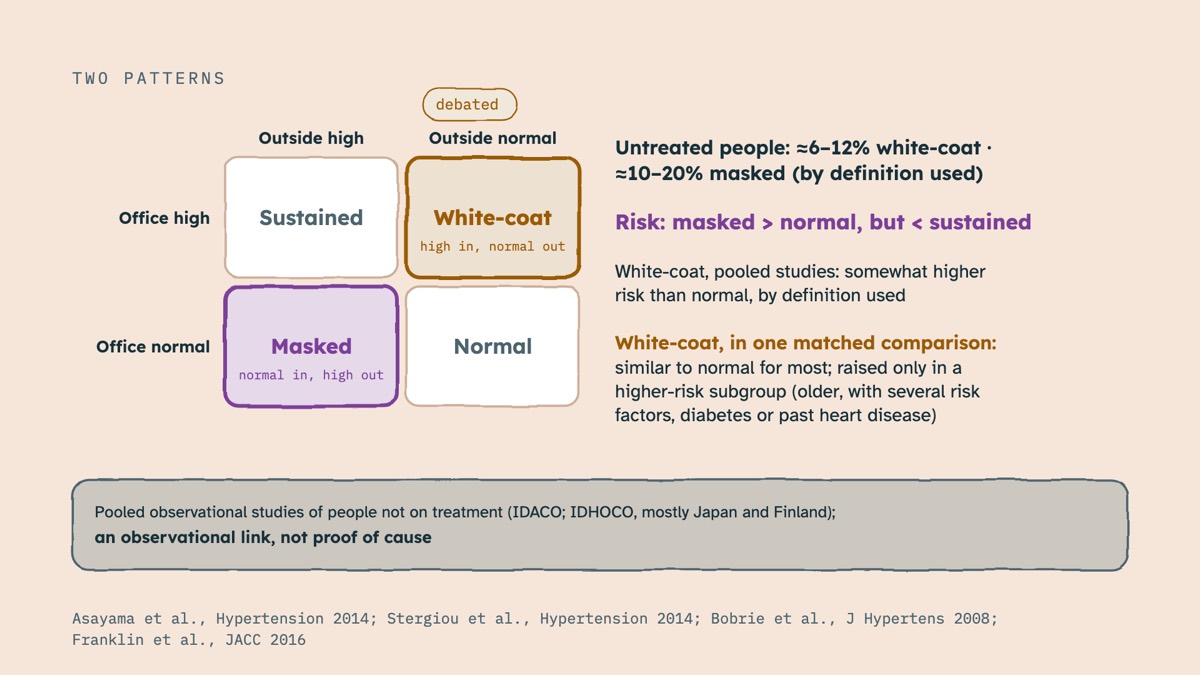
That gap has names. White-coat hypertension means readings that are high in the office but normal outside it. Masked hypertension is the reverse: normal in the office, high outside. In pooled observational studies of people not on treatment, roughly 6 to 12 percent had a white-coat pattern and 10 to 20 percent a masked one, depending on how it was defined. Do they matter? In these studies, masked hypertension carried more risk than normal readings, but less than readings that were high both in and out of the office. White-coat hypertension is debated. In pooled studies it went with somewhat higher risk than normal readings, depending on the definition. But in one matched comparison, most people with it had heart risk similar to matched people with normal readings; the raised risk showed up only in a higher-risk group: older people with several other risk factors, diabetes or past heart disease. These are observational links, not proof of cause.
At around 40, though, the office isn't always the high one. In about 400 untreated US adults around 40, mostly with normal pressure, daytime readings on a 24-hour monitor averaged 8 to 9 points higher than their home or office readings, though daytime readings include ordinary activity, while home readings are taken seated at rest. In adults 65 and older on treatment, home and daytime averages were nearly identical, though individuals varied widely. So which setting reads higher depends on the person. That's one reason the US Preventive Services Task Force recommends confirming a high office reading with readings outside the clinic before starting treatment. And UK and Irish hypertension specialists say a diagnosis shouldn't rest on a single occasion, except in a crisis. Our listener's office reading at a clinic visit was 135 over 82, and the doctor didn't comment on it. We won't place that one reading in any category: office categories differ between guidelines, and one occasion isn't enough.
Why monitors disagree
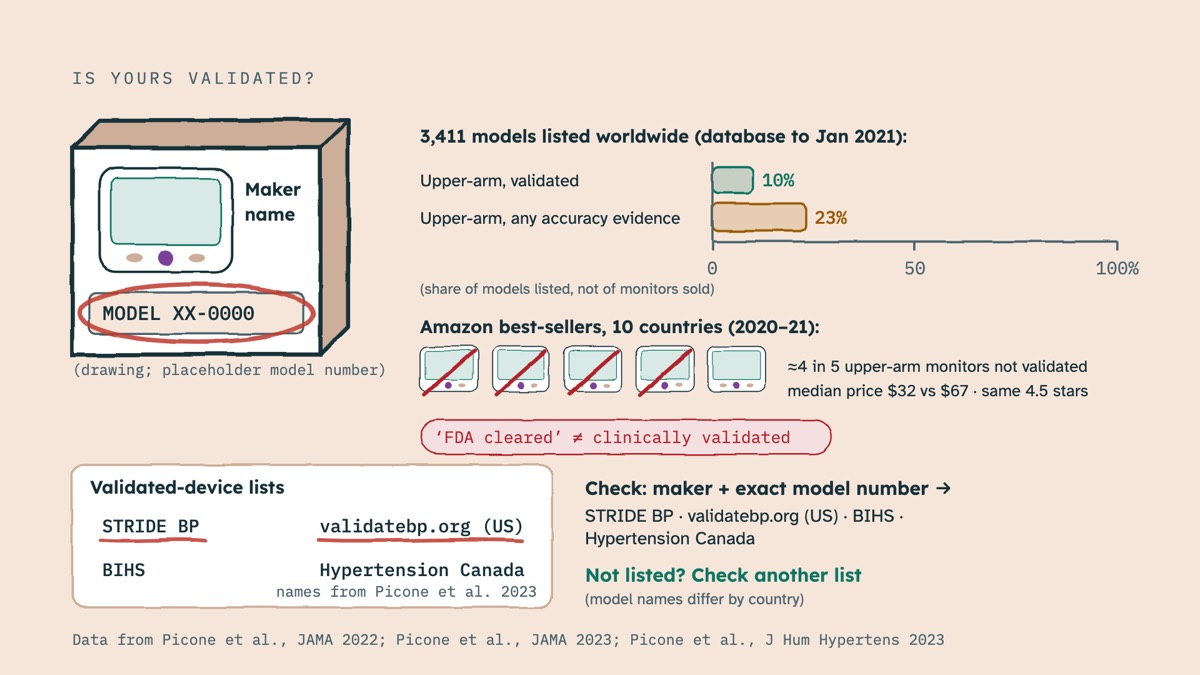
First, what validated means. Under the international standard, a monitor is tested on at least 85 people with a wide range of arm sizes and pressures, alternating with two trained observers using a stethoscope on the same arm, under ideal conditions. To pass, its average error must be within 5 points, with limited scatter, and the estimated chance that a person's average of three readings lands within 10 points must be at least 85 percent. So, in lab testing, a monitor right at the pass line could be more than 10 points off for up to about one person in seven. Most validated monitors do better, and the standard's own authors say passing isn't the same as perfect accuracy. If a monitor has a special averaging mode, check that its validation covers that mode.
And most monitor models on sale aren't validated. In a global database of 3,411 monitor models, only about one in ten upper-arm models was validated, and under a quarter had any evidence of accuracy testing. That's a share of models listed, not of monitors sold. On Amazon best-seller lists in 10 countries, about four in five upper-arm monitors weren't validated; they were cheaper, and got the same star ratings. "FDA cleared" on the box doesn't mean a monitor passed an independent accuracy test. So find the maker's name and the exact model number, and look it up on a validated-device list, such as STRIDE BP, or validate BP dot org in the US. If it isn't on one list, check another; model names differ by country.
Even two validated monitors can disagree. Each uses its own hidden formula, and some formulas are known to drift at higher pressures or in stiffer arteries. In the small study we mentioned, two certified monitors differed by a steady 11 to 13 points systolic on average, consistently in the same direction. They were used on separate lab days, with no reference device to say which was right, and the authors warn not to generalise the size of that gap. In a small French study from 2006, known only from its abstract, 152 referred patients with high blood pressure used two monitors for three days each. Their two systolic averages were within 5 points for only about half of them, and within 10 for about four in five. That gap includes ordinary change from week to week, and the authors judged the monitors comparable for most people.
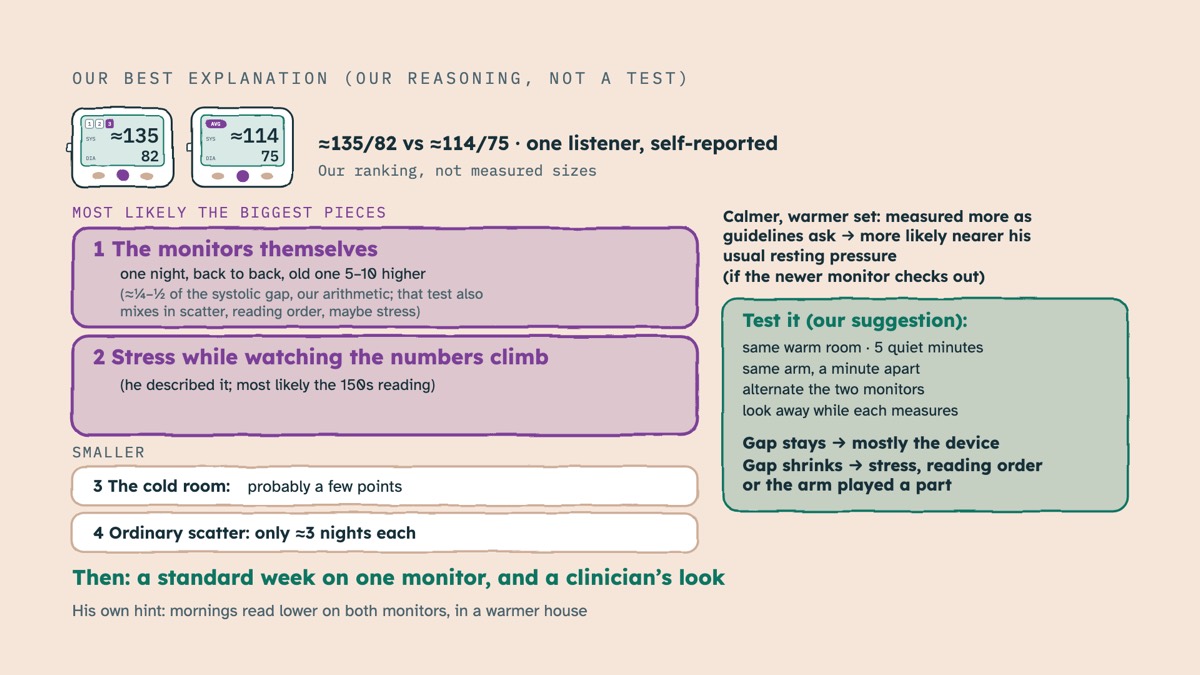
One night, our listener took readings back to back on both monitors, and the old one read 5 to 10 points higher. What's inside a gap like that? By our reasoning, four things. One, ordinary scatter: readings in a row wander by several points. Two, order: in that same small lab study, a reading taken straight after sitting down came out about 5 to 8 points higher than after ten minutes' rest. Three, each device's own offset. Four, possibly the arm: many people's two arms read a few points apart, though a 10-point gap is uncommon, about 1 adult in 30. The American Heart Association advises measuring both arms at the first visit, then using the higher one. So his gap fits within what's seen between validated monitors, plus scatter, order and arm effects. It can't tell him which monitor is right.
Here's our best explanation of his gap, ranked by our reasoning. Two pieces are most likely the biggest. One, the monitors themselves: back to back one night, the old one read 5 to 10 points higher, by our arithmetic a quarter to a half of the top-number gap, though that one test also mixes in scatter, reading order and maybe stress. Two, the stress he described while watching the numbers climb, which most likely explains the reading in the 150s. Smaller: the cold room, probably a few points, and ordinary scatter over about three nights each. So the calmer, warmer set is more likely nearer his usual resting pressure, as long as the newer monitor checks out against the clinic's. To check: in a warm room, after five quiet minutes, alternate the monitors on the same arm, a minute apart, looking away while each measures. If the gap stays, it's mostly the device. If it shrinks, stress, reading order or the arm played a part. A standard week on one monitor then gives his number for a clinician.
How can you check a monitor? The American Medical Association and the American Heart Association have a simple clinic test: alternate readings between your monitor and the clinic's, then compare. A gap under 5 points counts as fine; 6 to 10 needs a second step; over 10 means replacing the monitor. They suggest testing before first use, yearly, or whenever readings seem questionable. It's a practical rule of thumb, not a research-proven cutoff. In the clinic studies that used it, all readings were taken on the same arm, and the first home reading wasn't compared. One caution: the clinic's machine is itself an automated monitor. In one Boston clinic, about 1 in 5 home monitors, including well-known validated brands, disagreed with it by more than 10 points, so a mismatch doesn't prove which is wrong; repeat the check. And age matters. In an English study that pressure-tested the monitors themselves, not on people, those used for more than four years failed about five times as often: 26 percent, against 5.
And smartwatches, or other cuffless devices? According to the 2025 US guideline's official summary, and a 2026 American Heart Association statement, they shouldn't be relied on yet to diagnose or manage blood pressure. European experts don't recommend them either. Upper-arm cuffs remain the preferred type.
Measuring well, and for how long
Our listener had already seen our earlier video on measuring, so here's just the short recap, from the American Heart Association's checklist. Empty your bladder. Sit quietly for at least 5 minutes, back supported, feet flat, legs uncrossed, without talking. Put the cuff on bare skin just above the elbow, arm resting on a table at heart level, using the cuff size printed for your arm. Take two readings at least a minute apart, in the morning before any medicines and in the evening before bed, for a week if you can, three days at the very least. Keep every reading, and average them all. European experts ask for the same kind of week. Keep things like coffee or exercise the same before every check. And if you only manage three days, don't make them all weekend days.
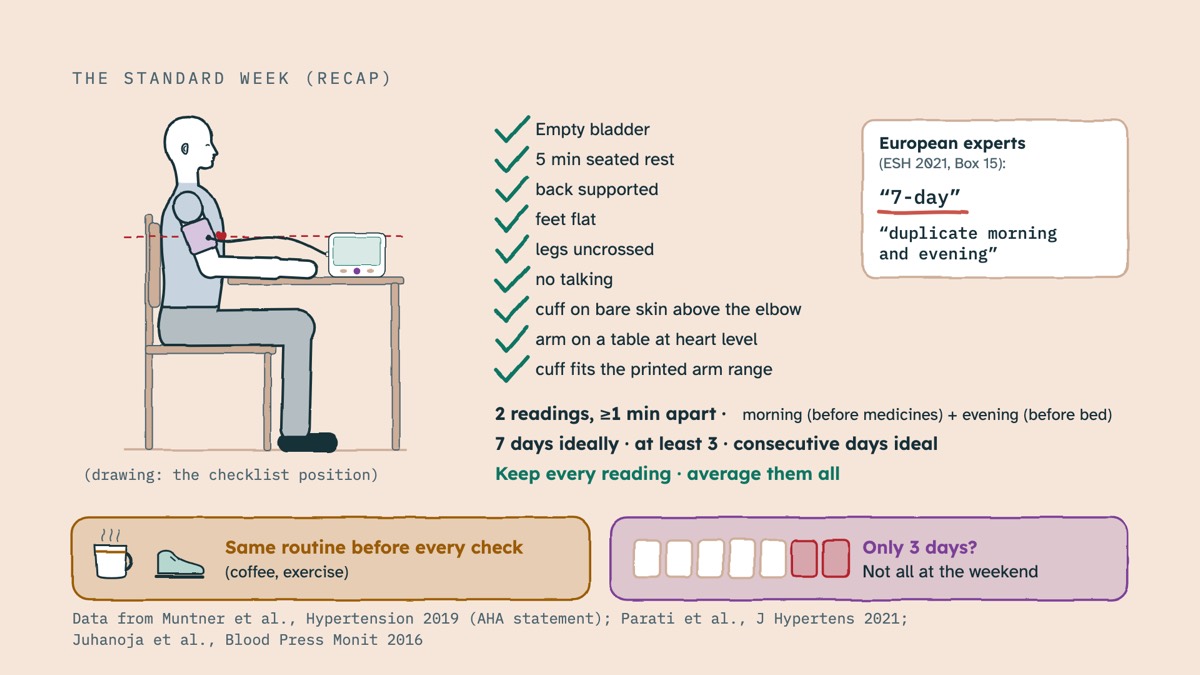
What about the first day? Experts disagree: in a small Greek study, day one ran high, while a Finnish study found no benefit from dropping it, and a New York study found day one no higher. The American Heart Association calls dropping it optional; if you do, add a day. European experts call it a matter of debate, with little impact over a full week.
How many days does the evidence support? For estimating the average and the risk, most of the information comes early: in a Finnish study with 162 cardiovascular events, three days captured most of the predictive power of a full week. Deciding which side of a line someone is on takes longer. In Japanese and Finnish groups, using one morning reading a day, about a week passed before the verdict stopped changing; with a monitor averaging three readings, in people with high readings, about four to five days. Our listener used each monitor for about three nights. Our synthesis: guidelines prefer a full week on one monitor, and the extra days matter most when an average sits close to a line.
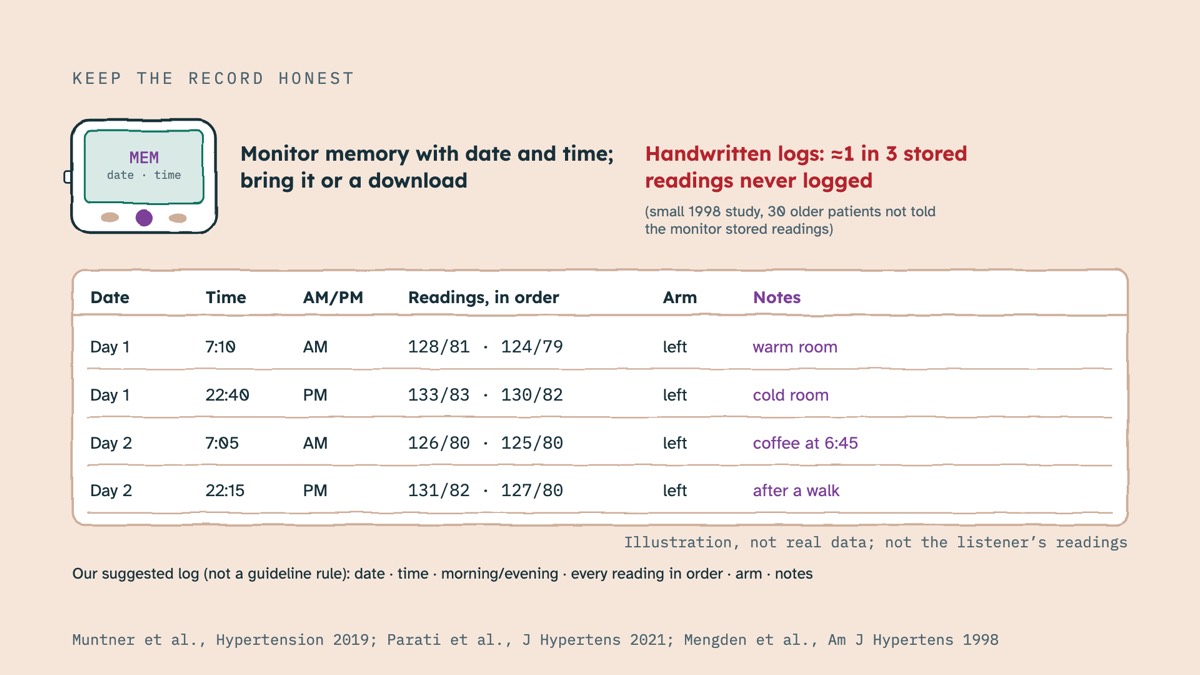
Keep the record honest. Use a monitor that stores every reading with its date and time, and bring it, or a download, to your appointment. Handwritten logs lose readings: in a small 1998 study of 30 older patients who didn't know their monitors stored readings, about a third of the stored readings never made it into their logs. A simple log, our suggestion rather than a guideline rule: the date and time, morning or evening, every reading in order, the arm you used, and a note of anything unusual, like a cold room, coffee or exercise.
And when two monitors disagree? The guidance texts we read, from the US, Europe and Japan, plus one expert paper, all describe one validated monitor used the same way all week. Two of them, the American Heart Association's 2019 statement and the European experts' 2021 paper, warn that different monitors aren't interchangeable. None we read covers averaging two monitors together. So the fix, by our synthesis, is to pick one validated monitor, do one standard week, and get a clinician's look, possibly with a 24-hour test.
That 24-hour test is ambulatory monitoring: a cuff worn for a day and a night that inflates every 15 to 30 minutes, including during sleep, while you keep a diary of when you slept. The American Heart Association calls it the reference standard outside the clinic, with a home week as the alternative. In one large pooled analysis of cohorts, night-time and 24-hour averages carried the most information about future risk, though the advantage was statistically modest; those are observational links, mostly in middle-aged and older people outside the US. In a 2016 review of seven cohorts, neither home nor 24-hour monitoring clearly beat the other at predicting events. And in a study of adults 65 and older on treatment, the two agreed on average, but one person's two numbers could differ by about 20 points either way. It isn't comfortable for everyone: in one small Greek study of 104 patients, at a clinic that favours home monitoring, more than half found the 24-hour monitor uncomfortable.
Which numbers matter
Lines depend on where a reading is taken, and on who draws them. For office readings, the 2025 US guideline, as summarised in reviews of it, keeps the 2017 categories. Normal is below 120 over 80. Stage 1 starts at 130 over 80. Stage 2 starts at 140 over 90. The European Society of Hypertension's 2023 guideline, as summarised by the European Renal Association, calls 140 over 90 and above in the office hypertension. These are categories for readings confirmed over time, not for a single number.
Home averages have their own lines, and the US and Europe differ. On the US scale, the 2017 table that the American Heart Association reproduced in 2019, a home average of 130 over 80 lines up with an office 130 over 80. According to a European kidney-society commentary's redraw, the 2025 update shows the same values, though we couldn't read the 2025 table itself. The American Heart Association notes these matching values weren't derived from randomised trials. European experts use 135 over 85 for a home average, as the match for 140 over 90 in the office, and call the US home line only partly outcome-based. Either way, average the whole week, then compare it with the home line, not the clinic line, and not the line for sleep, because bedtime readings are awake readings. Our listener's numbers aren't standard-week averages, so we won't place them against either line.
Now, that one reading in the 150s. Guidelines judge an average, not the single highest number, and first readings often run higher. In the small lab study we've mentioned, readings taken straight after sitting down were about 5 to 8 points higher than after ten minutes' rest. In real-world data from one monitor maker's customers, analysed partly by its staff under uncontrolled conditions, systolic fell roughly 4 to 6 points over five minutes of repeated measuring. In a big US survey, about a third of people whose first reading was in the 140s or 150s dropped a category once their second and third readings were averaged.
There's a statistical pull, too. In one trial's data on 286 patients, people who started with high home readings later averaged closer to normal, partly because of regression to the mean: an unusually high reading tends to be followed by less extreme ones. So, by our reasoning, one reading in the 150s, in a set averaging about 135 over 82, fits ordinary scatter plus first-reading and alerting effects. It's a reason to do a standard week. On its own, it can't show whether his blood pressure is high or normal.
One separate point now, as general safety information, not about our listener's readings. Readings of about 180 over 120 or higher are too high, and need medical attention. If a reading like that comes with a sudden severe headache, trouble breathing, sudden severe pain in the chest, back or belly, numbness or weakness, a sudden change in vision, or trouble speaking, call nine-one-one or your local emergency number. Don't wait to see if it comes down. If you have no symptoms, wait five minutes and measure again, and if it's still that high, call your healthcare provider. That's the advice of the US National Heart, Lung, and Blood Institute.
Blood pressure plus cholesterol
Our listener has high cholesterol, so this matters to him. Start with blood pressure: its risk is a slope, not a cliff. A study pooling about a million adults from 61 long-term studies found no point, down to at least 115 over 75, where lower long-run pressure stopped going with fewer deaths from heart disease and stroke. At ages 40 to 69, people whose long-run systolic was 20 points higher had about double the death rate from heart disease, and more than double from stroke. That compares groups in older studies, and it's about death rates, not one person's reading. In over a million English patients, those classed as having high blood pressure at 30, meaning 140 over 90 or more, or treated, had about a 63 percent chance of cardiovascular disease by 95, against 46 percent with normal pressure. That's an observational study of health records, and those lifetime figures are modelled.
Does blood pressure in young adulthood matter? In a US study that followed about 4,850 people who joined at ages 18 to 30, those whose highest pressure before 40 was in the elevated or stage 1 range had more cardiovascular events later than those with normal readings. But absolute rates stayed low: about 1.4 events per thousand people a year with normal readings, against about 2.7 and 3.2. These are group rates, not anyone's personal risk, and an observational link with few events. Cholesterol is similar. In pooled US studies, LDL, the so-called bad cholesterol, at 100 or more in young adulthood went with about 64 percent higher coronary heart disease risk later, a relative figure from partly estimated levels. And in one long US study with few events, cholesterol seemed to work like a running total, with earlier exposure counting more.
So how do the two combine? Risk calculators multiply risk factors rather than adding them, so, by our reading of how those models work, a cholesterol problem matters more when blood pressure is also up, and the other way round. Genetics points the same way. In white British volunteers, people whose genes gave them slightly lower LDL cholesterol and systolic pressure all their lives had about 40 percent lower odds of coronary events, close to multiplying the two effects. That's a lifelong genetic effect, not the effect of pills, and the lead author is paid by cholesterol-drug makers. In a trial of people in their 60s at intermediate risk, part-funded by the drugs' maker, lowering both with pills cut heart attacks, strokes and cardiovascular deaths from 5 in 100 to under 4 in 100 over about five and a half years. We found no such trial starting around age 40.
That's why clinicians use a calculator rather than one number. The American Heart Association's PREVENT calculator was built from data on more than 6 million US adults. It asks for age, sex, systolic pressure, cholesterol, diabetes, smoking, kidney function, and whether you take blood pressure or cholesterol pills. It's the American Heart Association's own calculator, tested mainly by its developers; its 30-year figures haven't been independently validated, and it was built on clinic readings: we found no validation of entering home averages. For scale, US adults in their 30s to 50s had an average predicted 10-year risk of heart attack or stroke of about 2 percent, and a 30-year risk near 10 percent. Those are predictions averaged across ages and both sexes, not anyone's personal number, and we won't give our listener one.
What does the US do with those numbers? According to the 2025 US guideline's official summary, for average readings in the 130s over the 80s, medication alongside lifestyle change is advised straight away if PREVENT puts 10-year cardiovascular risk at 7 and a half percent or more, or with heart disease, diabetes or kidney disease. For lower-risk people, three to six months of lifestyle change come first, and medication is added if the average stays at 130 over 80 or higher. A statement by the calculator's developers frames this as a conversation about overall risk and preferences, not a single number.
What's the evidence for pills in lower-risk people at that level? One expert group says direct outcome evidence is currently lacking, and we found no such trial in the sources we read. Across 48 trials, mostly in higher-risk people, each 5-point drop in systolic cut major cardiovascular events by about a tenth, a relative figure. In absolute terms, an earlier analysis of 11 trials found that treating 1,000 people in its lowest-risk group for five years prevented about 14 events, against 38 in the highest-risk group, and even that lowest group was at higher risk than a typical 40-year-old.
New US cholesterol guidance from 2026 also uses PREVENT. According to its press release, it suggests a one-time blood test in adulthood for LP-little-a, a cholesterol-carrying particle whose level is largely inherited. It also lists a coronary calcium scan, a CT scan that shows calcium in the heart's arteries, as an option for men 40 and older and women 45 and older at borderline or intermediate risk, when the result would help decide on a statin, a cholesterol-lowering pill. According to an analysis by one of its authors, its advice to treat earlier rests mainly on observational evidence.
What changes blood pressure
According to the 2025 US guideline's official summary, the lifestyle list is the same for all adults, whether to prevent or to treat high blood pressure: a healthy weight, a heart-healthy eating pattern such as DASH, less sodium, more potassium from food, regular exercise, managing stress, and less alcohol, with none as the goal, or at most one drink a day for women and two for men. If you have kidney disease or take certain medicines, check with a clinician before adding potassium. DASH is an eating pattern rich in vegetables, fruit, whole grains and low-fat dairy, and sodium makes up about 40 percent of salt, by weight. Whichever of our listener's numbers turns out closer to the truth, the same habits are recommended. An honest caveat: in the 110s to 130s range, each change is worth a few points at most, on average, smaller than in people with hypertension, but real.
Exercise first. Across many trials, regular aerobic training lowered systolic pressure by about 3 and a half points in healthy adults: about 8 in groups with hypertension, about 2 in groups averaging in the 120s and 130s, and not clearly anything in groups with normal pressure. Those are averages across groups of trials, comparing different studies. A large 2023 analysis of 270 trials found all exercise types help, with short static holds such as wall sits ranked surprisingly high, though from small, short trials. Exercise and single blood pressure drugs looked similar on paper in people with hypertension, but only by indirect comparison; the review found no head-to-head trial in its search, up to September 2018. Our listener already exercises five or more days a week, one of the best-supported habits.
Salt is the other big lever. In trials of four weeks or more, cutting about a teaspoon of salt a day lowered systolic pressure by about 4 points on average: about 5 with hypertension, about 2 without. That review's authors campaign for less salt, but an independent analysis found similar results: roughly one point per gram of sodium in people without hypertension, with thin evidence below about 2 grams a day. The US target is under 2,300 milligrams of sodium a day, moving toward 1,500; the average American man excretes over 4,000 milligrams. In one US study of 450 adults, about 70 percent of sodium was added before food reached the person, in factories or restaurants; salt added at home was only about a tenth. And with all food supplied, the DASH diet plus low sodium lowered systolic about 7 points in people without hypertension.
Other levers, briefly. The guideline's summary says potassium-based salt substitutes can help, especially when most salt goes in at home. In older, high-risk villagers in rural China, a potassium-enriched substitute cut strokes by about 14 percent: about 29 against 34 strokes per thousand people a year. People with kidney disease, or on certain blood pressure drugs, should check with a clinician first. Alcohol: cutting back lowered pressure in people drinking more than about two drinks a day; in short trials, mostly in men, cutting back from two or fewer made no measurable difference. Weight: about one point of systolic per kilogram lost, on average. Sleep: in large cohorts, short sleep went with a slightly higher chance of developing hypertension, an observational link, not proof of cause. And meditation trials, small and of uneven quality, show drops of about 3 to 4 points that may fade after a few months.
Some medicines and foods push pressure up. Over four months, prescription-dose ibuprofen raised 24-hour systolic almost 4 points in older arthritis patients at raised heart risk, in a Pfizer-funded trial with no painkiller-free group. Pseudoephedrine decongestants add about a point. Real liquorice added about 3 points in two weeks, in a small trial of 28 healthy young volunteers, not yet repeated. And ADHD medicines added a couple of points in short trials, with very low certainty. If you take any of these on prescription, don't stop or change them on your own; mention it to whoever prescribes them. For any supplement, ask a pharmacist.
One more thing lifestyle can't do. Diet and exercise change your actual blood pressure over days to weeks, and they change it for both cuffs alike. So, by our reasoning, they can't explain two cuffs disagreeing by 5 or 10 points minutes apart. That's a question about the devices, and how the readings were taken.
Making changes stick
Here's the honest part: trial effects shrink in real life. When all food is supplied, as in the DASH feeding trials, effects are biggest; when people are coached instead, they're smaller, by our reading across different trials. In a US trial of 810 untreated volunteers, with readings from the 120s to the 150s, a coached programme lowered systolic about 4 points more than advice alone at six months, and about a third reached below 120 over 80, against a fifth with advice. By 18 months, the extra blood pressure benefit had narrowed and was no longer statistically clear, though habits partly stuck. In a larger prevention trial of overweight adults aged 30 to 54, a six-month drop of 3 to 4 points shrank to about 1 point by three years, as weight came back and sodium drifted up.
Weight shows it most clearly. In that trial, an average weight loss of about 4 and a half kilograms at six months was almost all gone by three years. The minority who kept about 4 and a half kilos off did much better, but they chose themselves, so that isn't proof of cause. Five years after US structured weight programmes, people who completed them kept off on average only about a sixth to under a third of what they'd lost. When people are simply advised to cut salt and followed for years, the average drop is about one point. And apps and text programmes for people with hypertension gave about a 3-point drop in trials of 3 to 12 months, but only 2 of 17 trials followed people after the programme ended.
So what helps? Across 122 evaluations of eating and activity programmes, the ones that had people track the behaviour itself, and combine that with steps such as setting goals, worked better on average; that compared across studies, and measured behaviour, not blood pressure. If-then plans, like "if I eat out, then I'll ask for no added salt", helped people add healthy foods in trials, though those effects may be overstated; for exercise, they helped clearly only when someone followed up. Coaching, often by phone or from a nurse, gives a small extra blood pressure benefit in people with hypertension. In people with hypertension, watching their own numbers doesn't, by itself, change diet or exercise much, though the evidence is thin. And home monitoring helped blood pressure in people with hypertension when it was part of a plan with support, not on its own.
Not everyone responds to a given change, either. In a one-week US study of 213 people aged 50 to 75, about one in four people's pressure didn't fall on the low-sodium week compared with the high-sodium week, and part of that was measurement noise. For our listener, by our reasoning, that means expecting modest gains, and measuring them over weeks, on one monitor, with a standard week, not by comparing two devices.
Before you go
If you're in a similar spot, here are questions worth bringing to a clinician. One: would a standard home week, on one validated monitor, be useful, and which home line do you use? Two: can we check my monitor against the office device? Three: since my two monitors disagree, would a 24-hour monitor help? Four: what do my 10-year and 30-year risks look like on PREVENT, with my cholesterol included? Five: is a one-time LP-little-a test relevant, and, if a statin decision is uncertain, a calcium scan? And six: should we measure both arms?
So, which reading is the real one? None of them, alone. Our best explanation of our listener's gap is a stack: the monitors themselves, the stress of watching the numbers climb, the cold room, and ordinary scatter. Two validated monitors can disagree by more than 10 points, and our listener's comparison mixed the device, the display, the cold room and warmer clothes, the nights and ordinary scatter, so it can't prove which number is true, though, by our reasoning, the calmer, warmer set is more likely nearer his usual pressure, as long as the newer monitor checks out. The answer is an average: one validated monitor, a standard week, every reading kept, and a clinician's look. One reading in the 150s is a reason to measure properly, not a diagnosis. And because risk tools, by our reading, multiply blood pressure and cholesterol together, an overall risk estimate matters more than any one number.
Sources
10 sources cited in the video, in the order they come up.
Key sources
- Muntner 2019 (AHA)
- Parati 2021 (ESH)
- Kollias 2020
- NHLBI
- FIGURES SHOWN UNDER CC BY 4.0
- Sharman JE et al., J Hum Hypertens 2023, Fig. 2, cropped (lower panels), marks added
- Umishio W et al., Hypertens Res 2021, Fig. 3, cropped to panel A, marks added
- Warneke K et al., BMC Cardiovasc Disord 2026, Fig. 3, shown whole, zoomed, red-pen bracket added
- Tucker KL et al., PLoS Med 2017, Fig. 1, cropped and rearranged (rows omitted), marks added


