
What Does Your Waist-to-Height Ratio Really Mean?
Inside this episode
The video’s narration, chapter by chapter, with stills from the video and every source at the end.
The short version
It's your waist divided by your height. Guidance in England says to try to keep it under 0.5, and higher numbers go with higher health risks, partly because a bigger waist tends to go with more fat deep in the belly. And you measure halfway between your lowest rib and the top of your hip bone.
What the ratio is
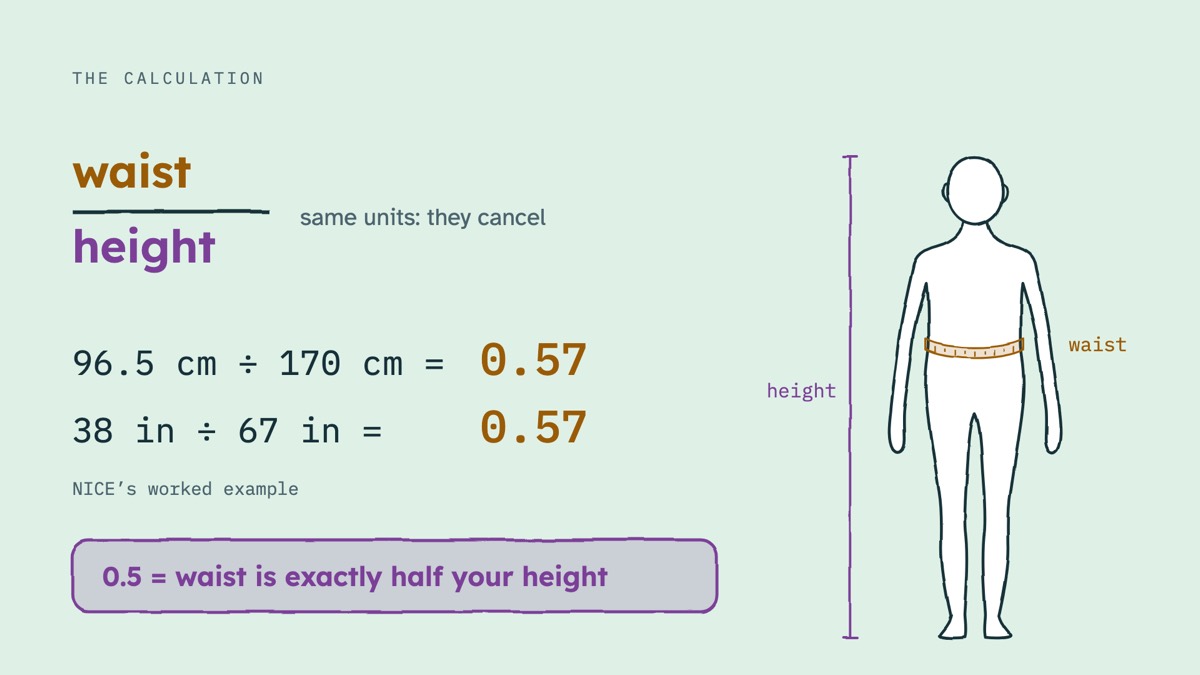
It's your waist divided by your height, in the same units, so the units cancel. In an example from NICE, which writes health guidance for England, a waist of 96.5 centimetres and a height of 170 centimetres give 0.57. In inches, 38 over 67 gives the same 0.57. So a ratio of 0.5 means your waist is exactly half your height.
What the numbers mean
NICE sorts adults into three bands. 0.4 to 0.49 is healthy. 0.5 to 0.59 means increased health risks. And 0.6 or more, further increased. These bands are for adults with a body mass index under 35.
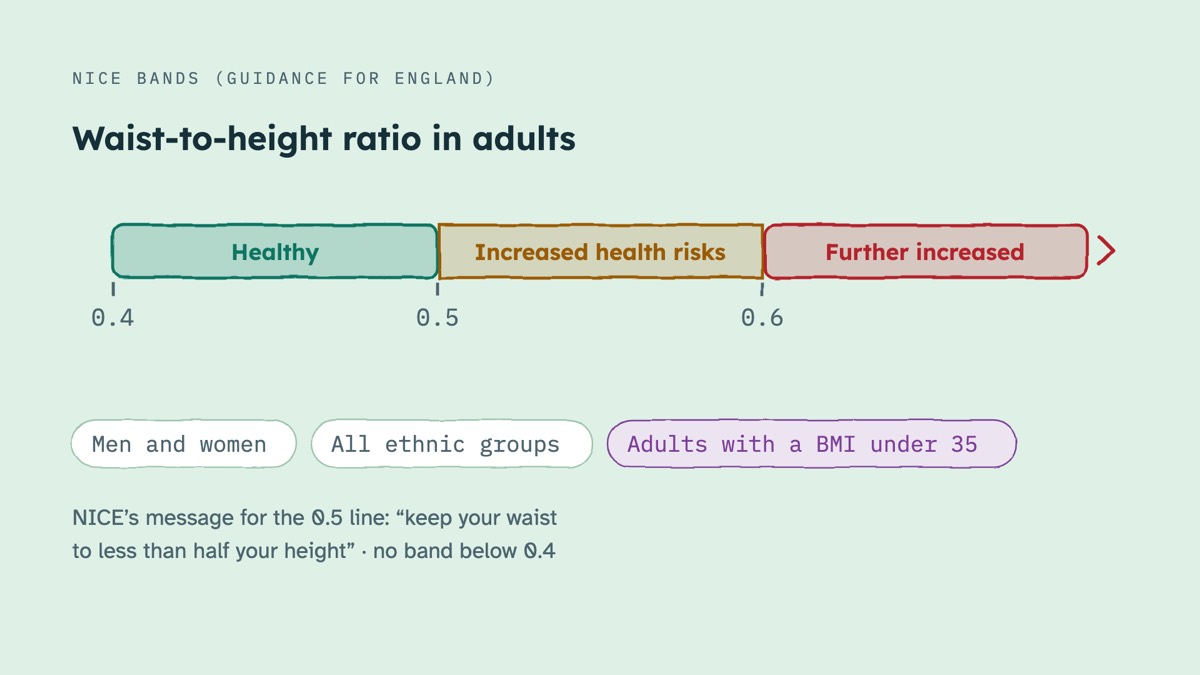
Why 0.5? A 2010 review gathered 78 studies. The cut-offs that best flagged heart disease and diabetes risk averaged 0.5, in men and in women, across studies from 14 countries. The 0.4 and 0.6 edges came from NICE's committee, based on its clinical judgement.
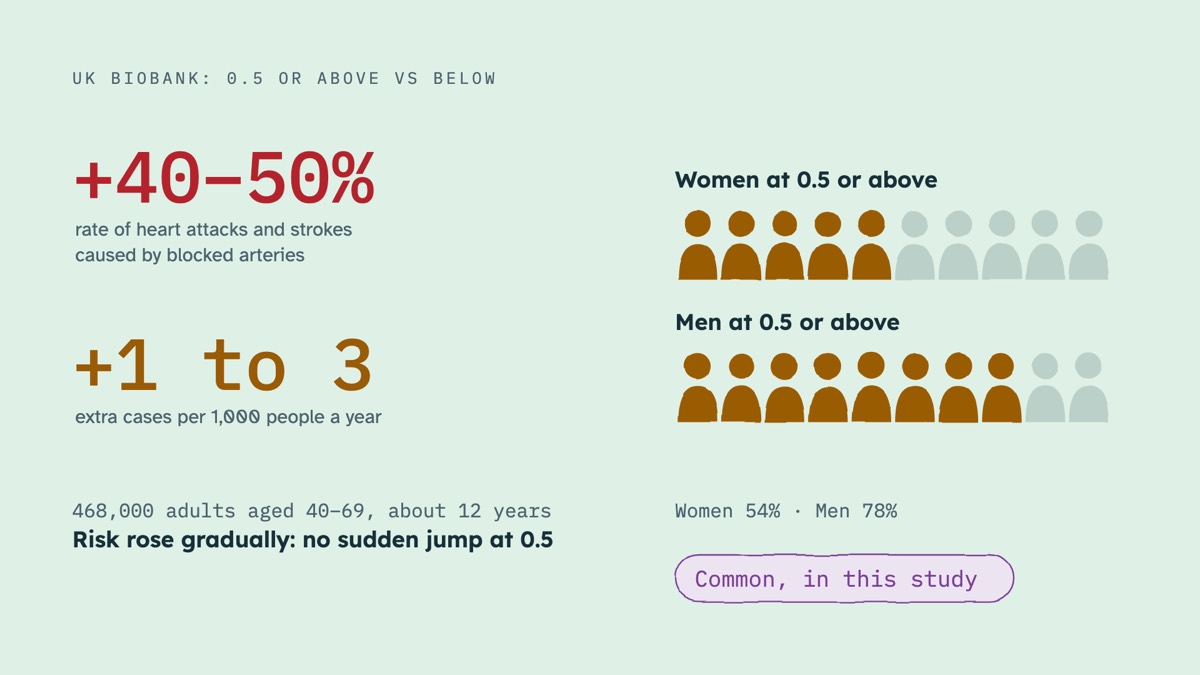
What goes with being at 0.5 or above? In UK Biobank, nearly half a million middle-aged adults, those at 0.5 or above had about 40 to 50 percent higher rates of heart attacks and strokes caused by blocked arteries: roughly one to three extra cases per 1,000 people each year. Risk rose gradually, with no sudden jump at 0.5. And it was common: just over half the women and nearly 8 in 10 men were at or above 0.5.
Is it better than body mass index? Slightly, in many comparisons, but the gap is small. Its edge is that it can flag weight around the middle even when BMI looks fine.
Why the waist?
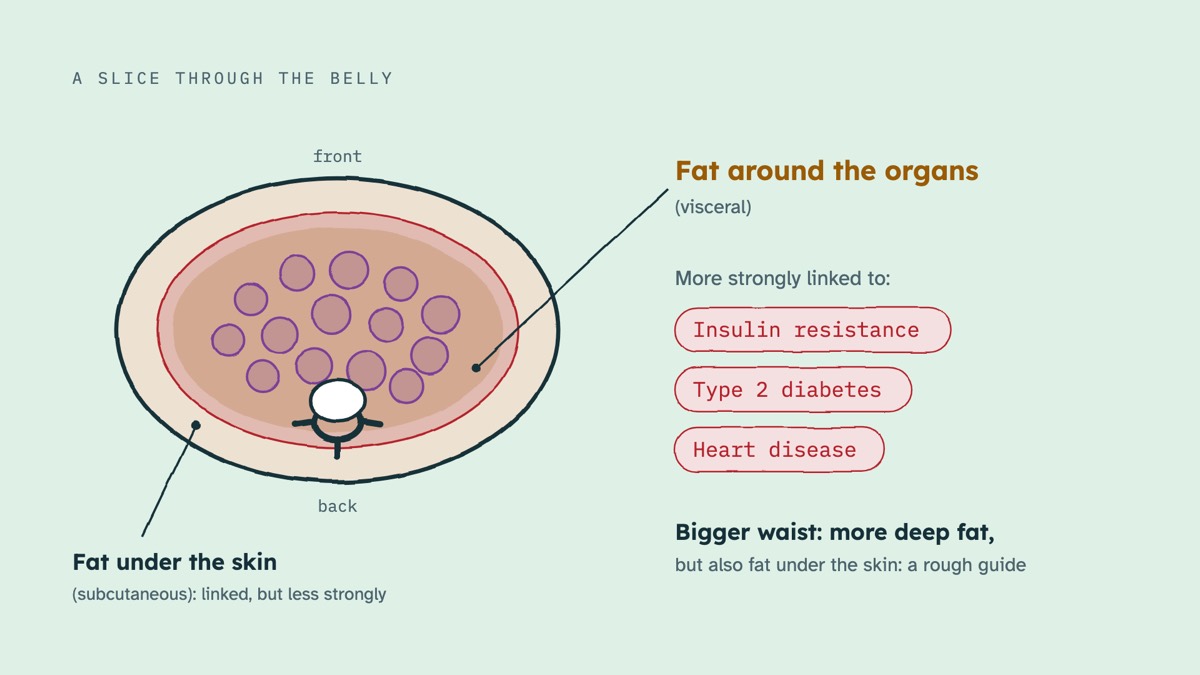
Not all body fat is the same. Fat deep in the belly, around the organs, is called visceral fat. In studies that scanned people's bellies, it was more strongly linked to insulin resistance, type 2 diabetes and heart disease than fat under the skin. A bigger waist tends to mean more of that deep fat, but it also reflects fat under the skin, so it's a rough guide.
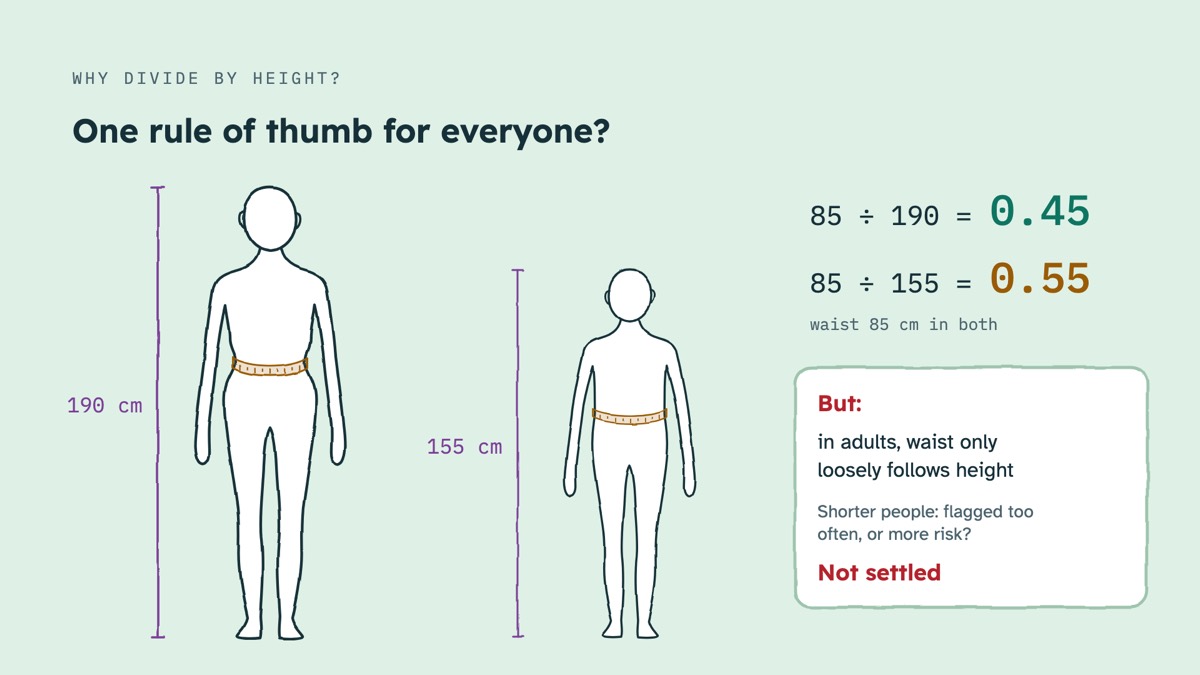
Why divide by height? The idea is one rule of thumb for men and women and across ethnic groups. But in adults, waist size only loosely follows height. With the same 85-centimetre waist, someone 190 centimetres tall scores 0.45; someone 155 centimetres tall, 0.55. Some researchers argue that flags shorter people too often; others point to data suggesting shorter people may carry more risk at the same waist. It isn't settled.
How to measure
Find the bottom of your ribs and the top of your hip bones, and wrap the tape halfway between them. For many people, that's just above the belly button. Keep it level and snug, not squeezing, on bare skin. Breathe out normally, and don't hold your tummy in. Then measure your height with shoes off, standing straight against a wall.
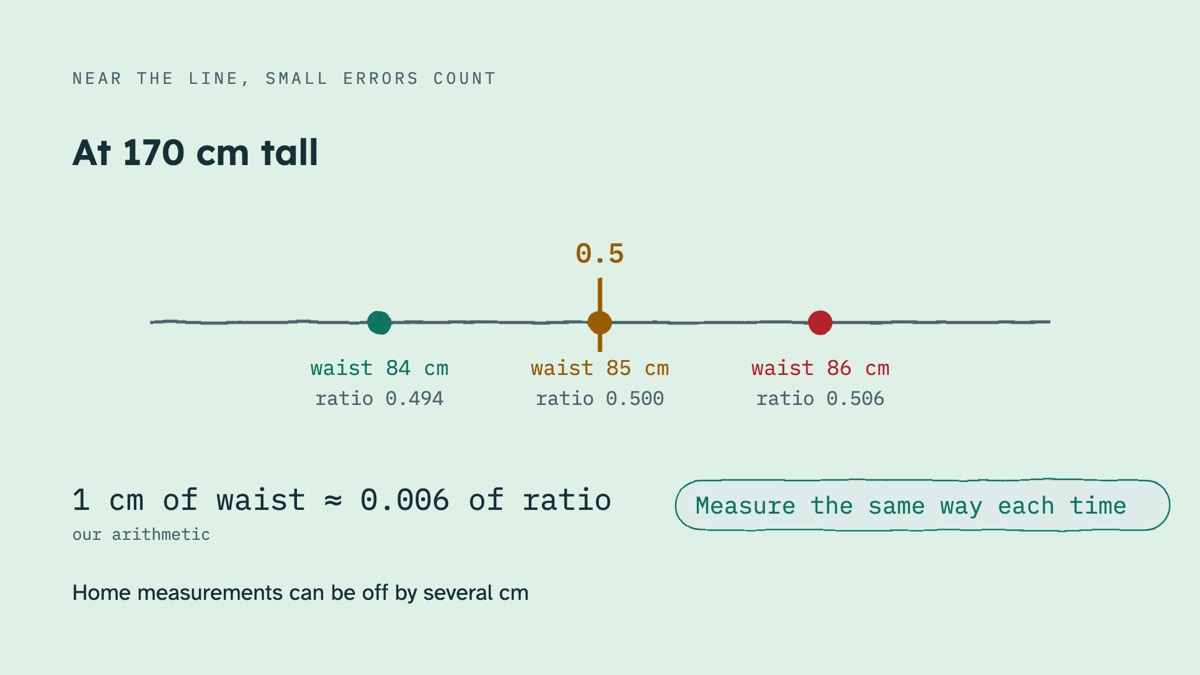
At 170 centimetres tall, the 0.5 line is an 85-centimetre waist, and each centimetre moves the ratio by about 0.006. Home measurements can be off by several centimetres, so measure the same way each time.
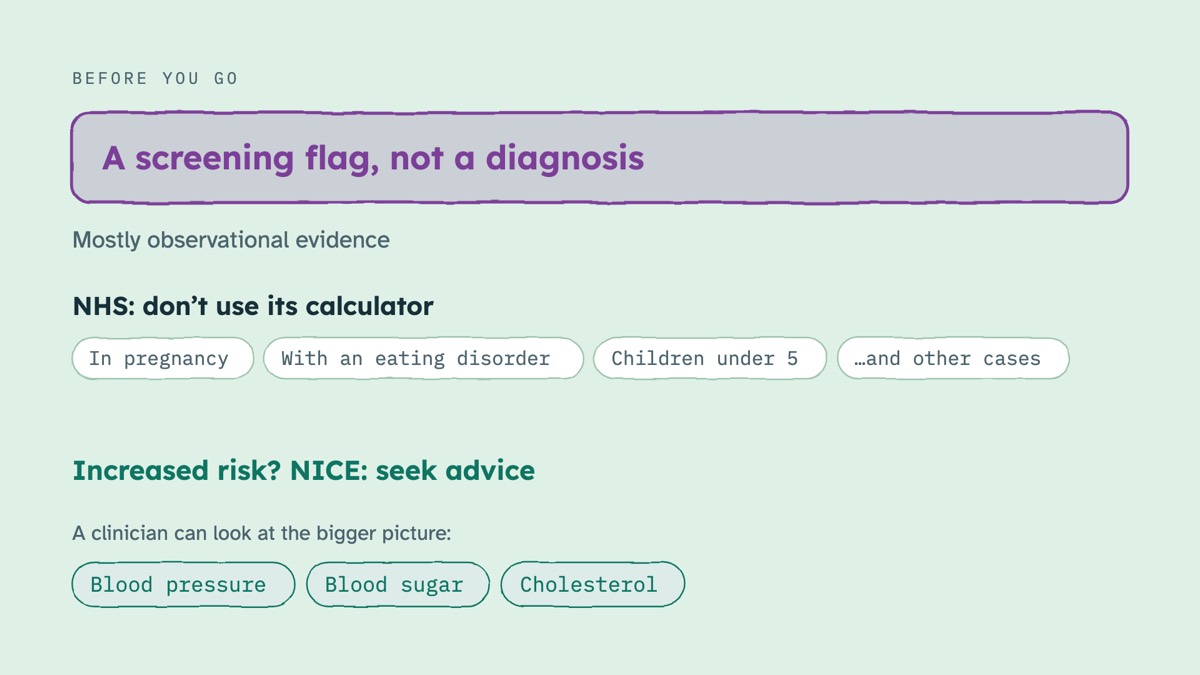
Before you go, a few limits. It's a screening flag, not a diagnosis, and the evidence is mostly observational. The NHS says not to use its calculator in pregnancy, with an eating disorder, or for children under 5, among other cases. And NICE encourages seeking advice if your ratio shows increased risk. A clinician can look at the bigger picture.
So: NICE's advice is to try to keep your waist under half your height. At 0.5 or above, health risks are higher on average, partly because a bigger waist tends to go with more fat around the organs. And measure halfway between your ribs and hips, after a normal breath out.
Sources
32 sources cited in the video, in the order they come up.
What the ratio is and what the numbers mean
- NICE NG246, overweight and obesity management (recs 1.9.14-1.9.15 and Box 1)
- NHS waist-to-height ratio calculator
- Hsieh & Yoshinaga 1995, an early waist-to-height study
- Ashwell & Hsieh 2005, "six reasons" for waist-to-height ratio
- Browning, Hsieh & Ashwell 2010, systematic review
- Ashwell, Gunn & Gibson 2012, meta-analysis
- Savva et al. 2013, waist-to-height ratio or BMI (meta-analysis)
- Feng et al. 2024, UK Biobank: (correction notice: ) [link 2]
- Jayedi et al. 2020, central fatness and mortality
- Jayedi et al. 2022, anthropometric indicators and type 2 diabetes
- Kodama et al. 2012, anthropometric measures and type 2 diabetes
- Gelber et al. 2008, measures of obesity and cardiovascular risk
- Patel et al. 2025, waist-to-height ratio and cause-specific mortality
- Ashwell & Gibson 2016, waist-to-height ratio and early health risk (UK survey)
- Rubino et al. 2025, Lancet Commission on clinical obesity
Why the waist?
- Fox et al. 2007, visceral and subcutaneous fat and metabolic risk (Framingham)
- Preis et al. 2010, abdominal fat and insulin resistance (Framingham)
- Neeland et al. 2012, fat distribution and type 2 diabetes (Dallas Heart Study)
- Britton et al. 2013, body fat distribution and cardiovascular disease
- Camhi et al. 2011, waist, BMI and visceral fat on CT
- Han et al. 1997, height and waist circumference
- Hsieh & Yoshinaga 1999, same waist, different heights
- Nevill et al. 2023, waist-to-height cut-offs and shorter adults
- Nevill et al. 2025, waist-to-height ratio in children and adolescents
- Emerging Risk Factors Collaboration 2011, BMI, waist and cardiovascular risk prediction
How to measure
- NHS, how to measure your waist
- WHO 2011, waist circumference and waist-hip ratio, expert consultation
- WHO STEPS surveillance manual, physical measurements
- NHANES 2021 anthropometry procedures manual
- Ross et al. 2020, waist circumference consensus statement
- Statistics Canada 2012, waist measured at two sites
- Barrios et al. 2016, reliability of self-measured waist


