
Healthy but High LDL: Should You Worry?
Inside this episode
The video’s narration, chapter by chapter, with stills from the video and every source at the end.
The short version
Here's what to expect. His markers mostly don't conflict: they count different things, and the one the evidence trusts most, apo B, sits a little below the middle of the population. His healthy profile lowers his overall risk, but it doesn't switch LDL off. And the biggest factor in his file isn't a lab value at all. It's his father's heart attack. We'll cover why the markers disagree, what good health can offset, the family history, the statin decision, diet, and the calcium scan.
Why the markers disagree
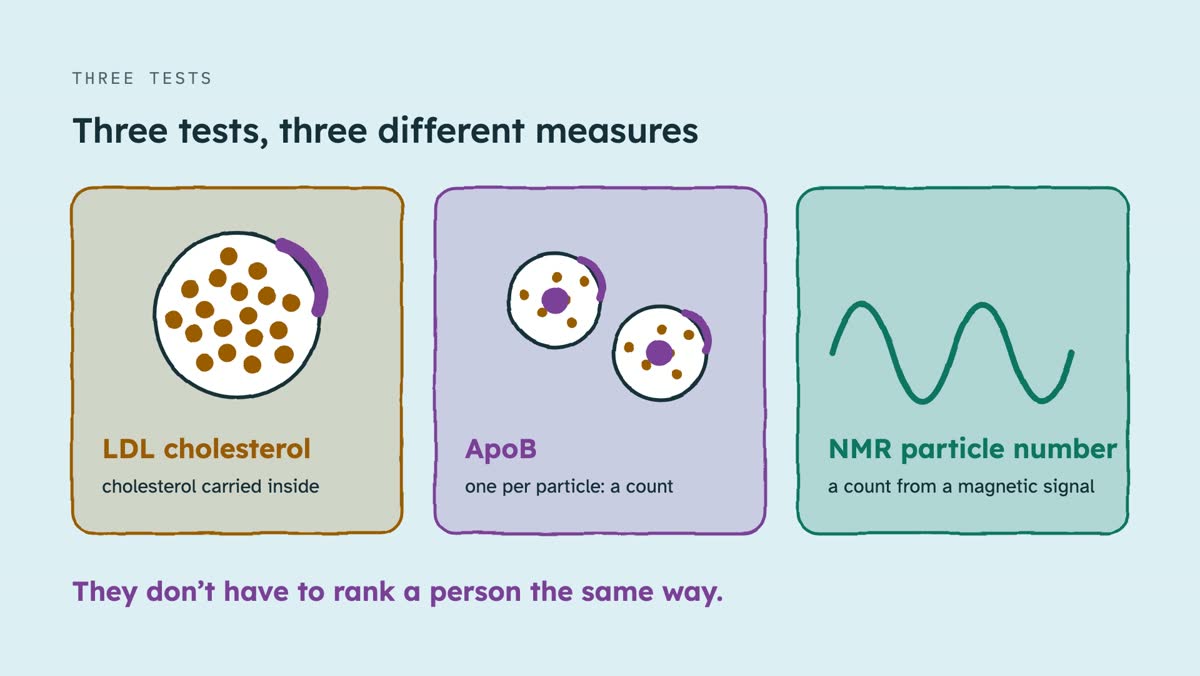
LDL cholesterol measures how much cholesterol is carried inside LDL particles. Apo B counts the particles themselves: each LDL and related particle carries exactly one. And the NMR particle number is a third method, counting LDL particles from a magnetic-resonance signal. Three tests measuring three different things don't have to rank a person the same way.
Against untreated U.S. adults of all ages, his LDL is around the 65th percentile. His apo B is around the 43rd, a little below the middle. His particle number lands roughly mid-pack to two-thirds of the way up, depending on the reference group. So why the flag? One big lab, for example, calls 1,300 to 1,599 "borderline high." That's a lab's own cut-off, not a guideline threshold.
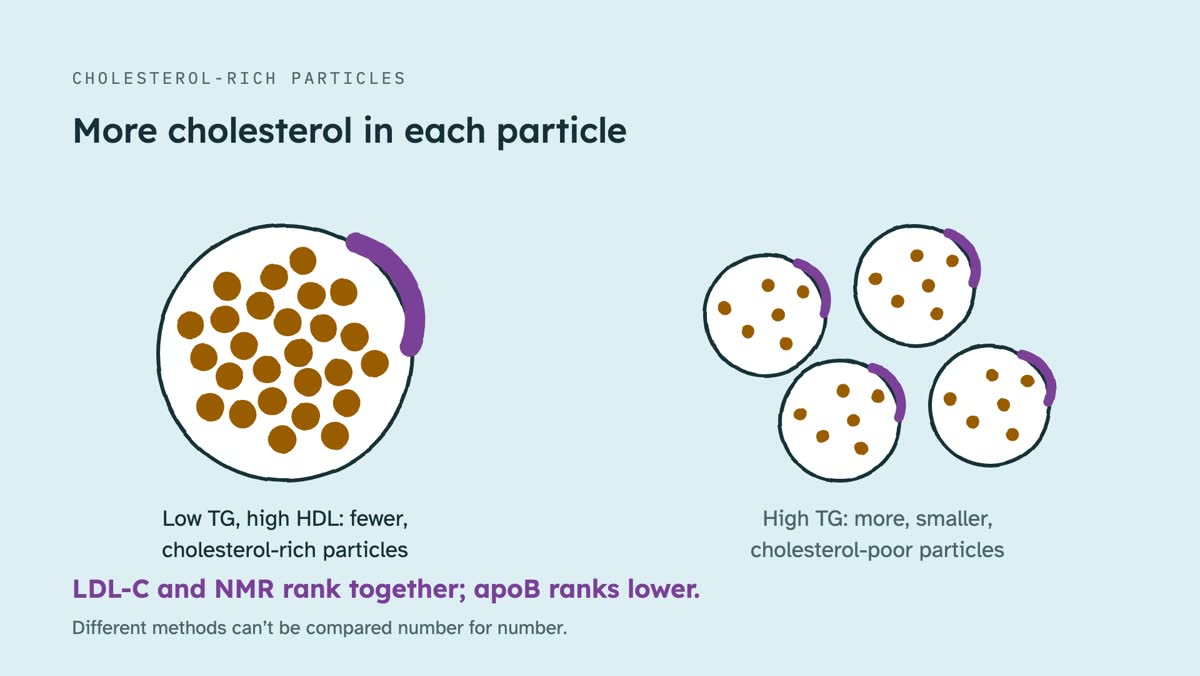
Why does his LDL cholesterol rank higher than his apo B? Low triglycerides and high HDL tend to pack more cholesterol into each particle. So his cholesterol number runs ahead of his apo B count, the pattern you'd expect in someone this lean and active. His NMR count ranks about where his LDL does, so the two particle methods don't fully agree either, which doesn't make either one wrong.
When the markers disagree, which one wins? Risk tends to follow the apo B particle count. In a long study of about 27,500 women, those with above-median LDL cholesterol but below-median apo B had about 40 percent lower coronary risk than women high on both. Genetic studies agree, so the evidence treats apo B as the referee. And the 2026 U.S. cholesterol guideline rates routine NMR particle testing as no benefit for judging risk or starting treatment.
And that HDL in the 80s? It signals healthy metabolism, but it isn't a shield. A gene variant that raises HDL didn't lower heart attack risk. Genetic studies suggest the benefit of his low triglycerides comes mainly through fewer apo B particles, which his apo B already counts.
Can good health offset LDL?
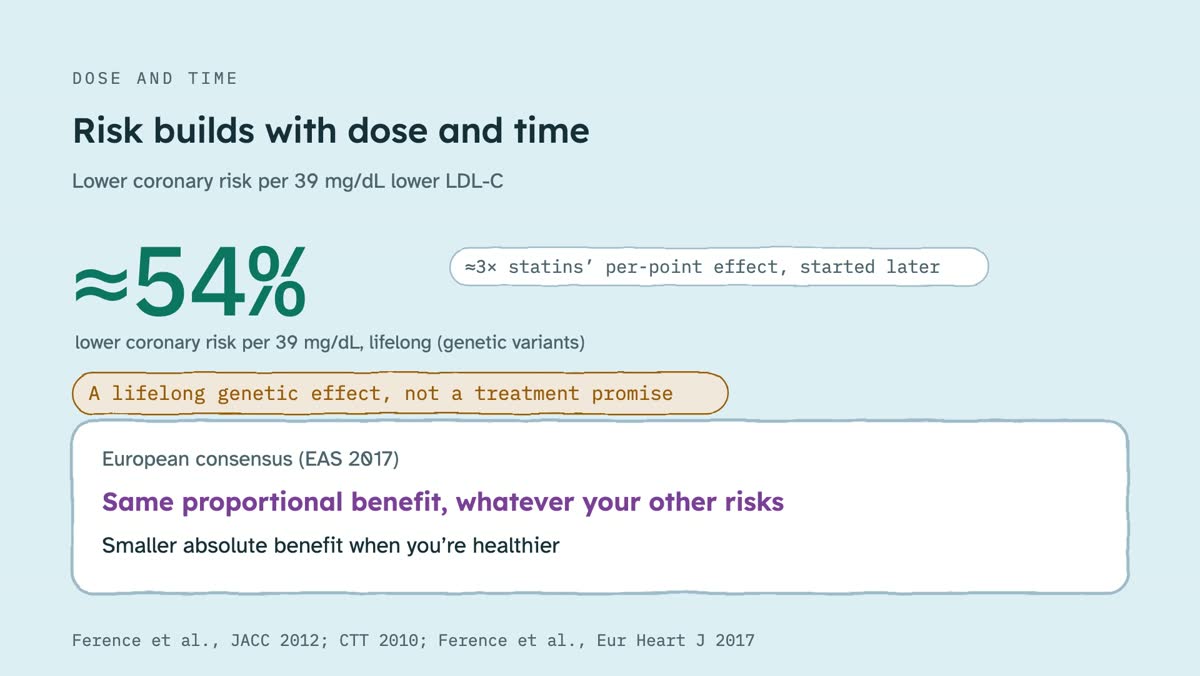
LDL causes atherosclerosis, and the risk builds with both dose and time. People born with genes that lower LDL had about 54 percent lower coronary risk for every 39 points lower LDL, about three times the per-point effect of statins started later in life. That's a lifelong genetic effect, not a treatment promise. The European consensus puts it this way: lowering LDL gives the same proportional benefit whatever your other risk factors. The absolute benefit is just smaller when you're healthier.
At his level, the evidence of harm is real but modest. Among healthy Spanish adults averaging 45, with no standard risk factors, about half already had some plaque in their arteries, and each 10 points of LDL raised the odds by 14 to 18 percent. Plaque isn't a heart attack, but it's where heart attacks come from.
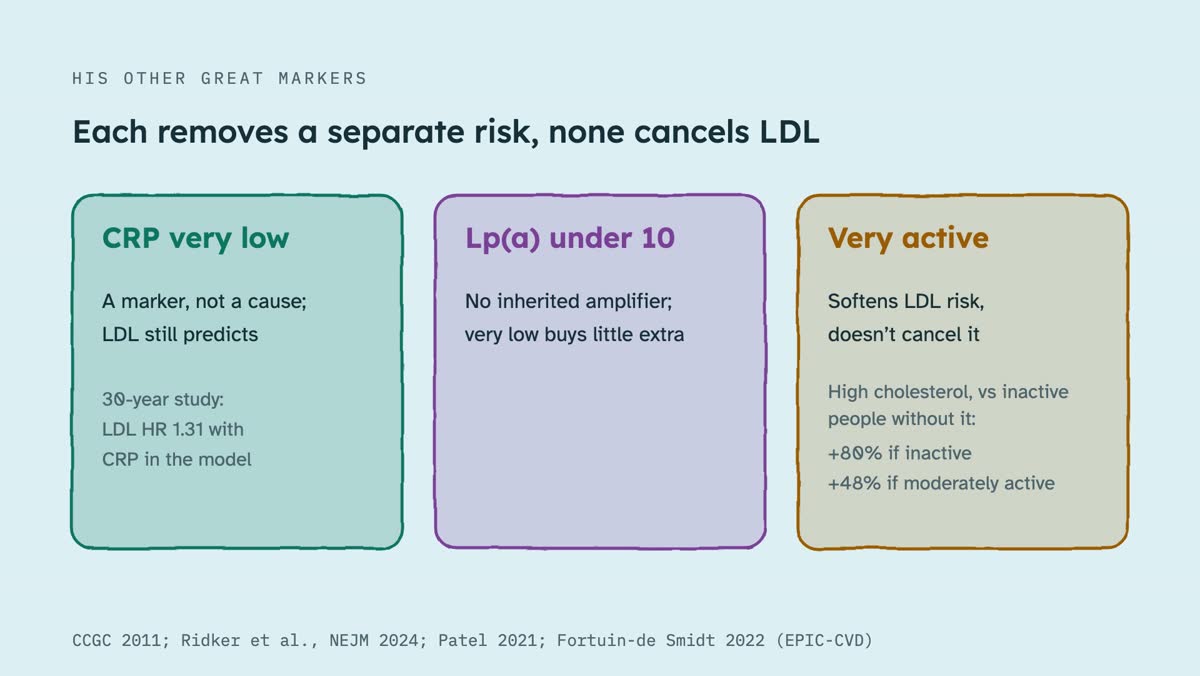
What about his other great markers? Very low CRP marks low inflammation, but genetically higher CRP doesn't raise heart risk, and in a 30-year study of women, LDL still predicted events with inflammation in the model. LP-little-a under 10 means he didn't inherit a common risk amplifier, but very low levels buy little extra. And activity softens LDL's risk rather than cancelling it.
One item points the other way: sleep. Under six hours scores 40 out of 100 on the heart association's sleep measure, and in the Spanish study, sleeping under six hours was linked to more plaque in arteries outside the heart, independent of standard risk factors: it's a lever in its own right.
You may have heard that high LDL is harmless in lean, healthy people on low-carb diets, so-called lean mass hyper-responders. He doesn't fit: that definition needs LDL of 200 or more on a low-carb diet. And the main follow-up study behind the claim was retracted this year, at the authors' and editors' request, over methodological problems with its data. The idea is unproven, not disproven.
His father's heart attack
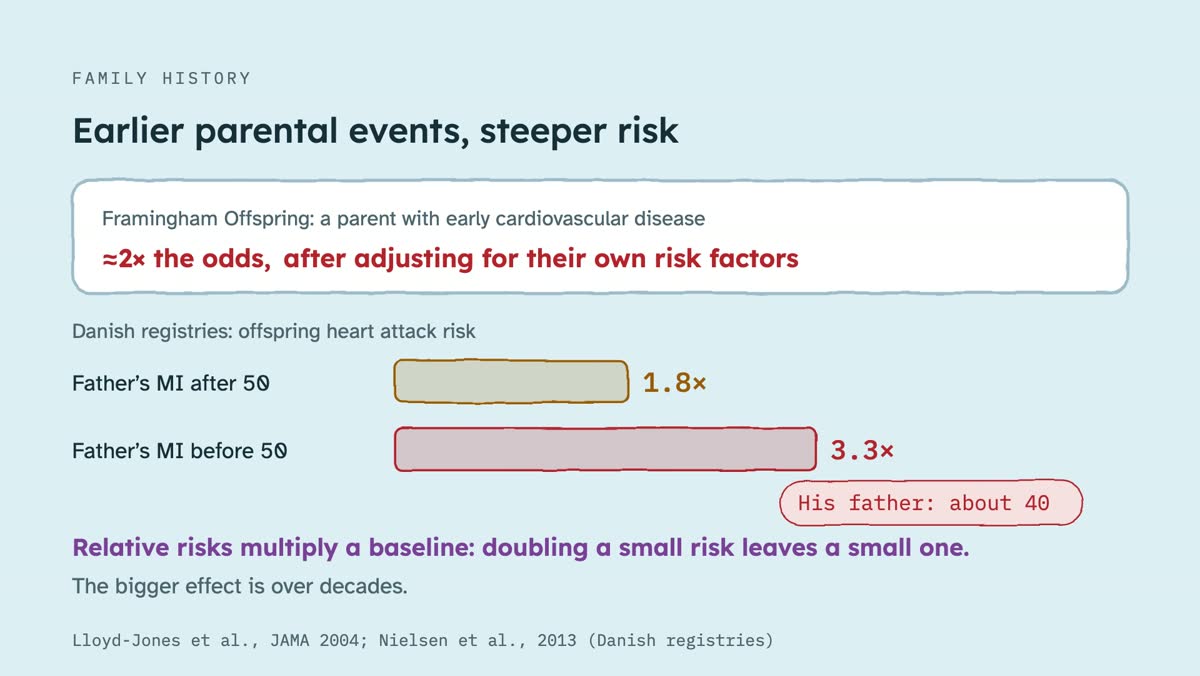
In the Framingham Offspring Study, men with a parent who had early cardiovascular disease had about twice the odds of a cardiovascular event, even after accounting for their own risk factors. The earlier the parent's event, the steeper the risk: in Danish registries, a father's heart attack before 50 was linked to about three times the heart attack risk in his children. His father's, at about 40, sits at the steep end. These are relative risks, though: doubling a small ten-year risk still leaves a small one. The bigger effect is over decades.
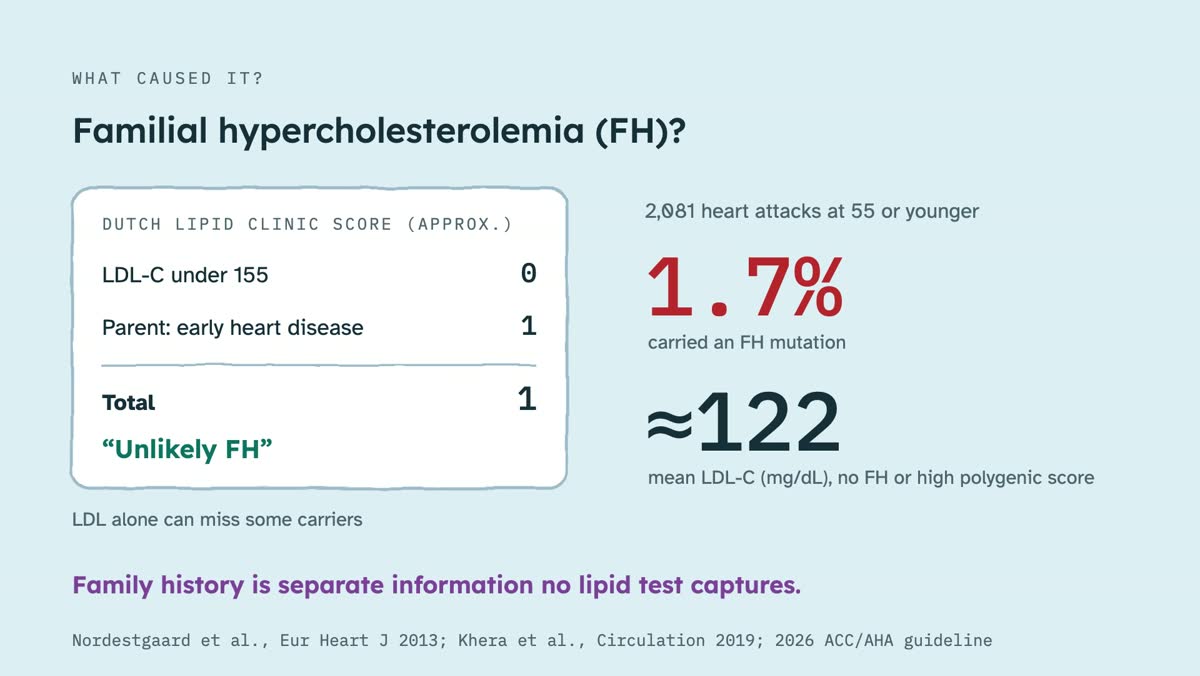
What caused his father's heart attack is unknown. One possibility is an inherited disorder, familial hypercholesterolemia. On the standard Dutch scoring system, his own LDL makes it unlikely that he carries it, though LDL alone can miss some carriers. And among over 2,000 people sequenced after heart attacks at 55 or younger, fewer than 2 percent carried one of those mutations, and the rest averaged a fairly ordinary LDL, in the low 120s. That's why family history counts as separate information that no lipid test captures.
The 2026 U.S. guideline counts his father's history as a risk enhancer. But the PREVENT calculator it uses to estimate risk leaves family history out entirely. And the guideline uses the phrase "strong family history" four times without ever defining it. Whether his father's history counts as strong is left to clinical judgment, and the answer matters for both a statin decision and a calcium scan.
The statin decision
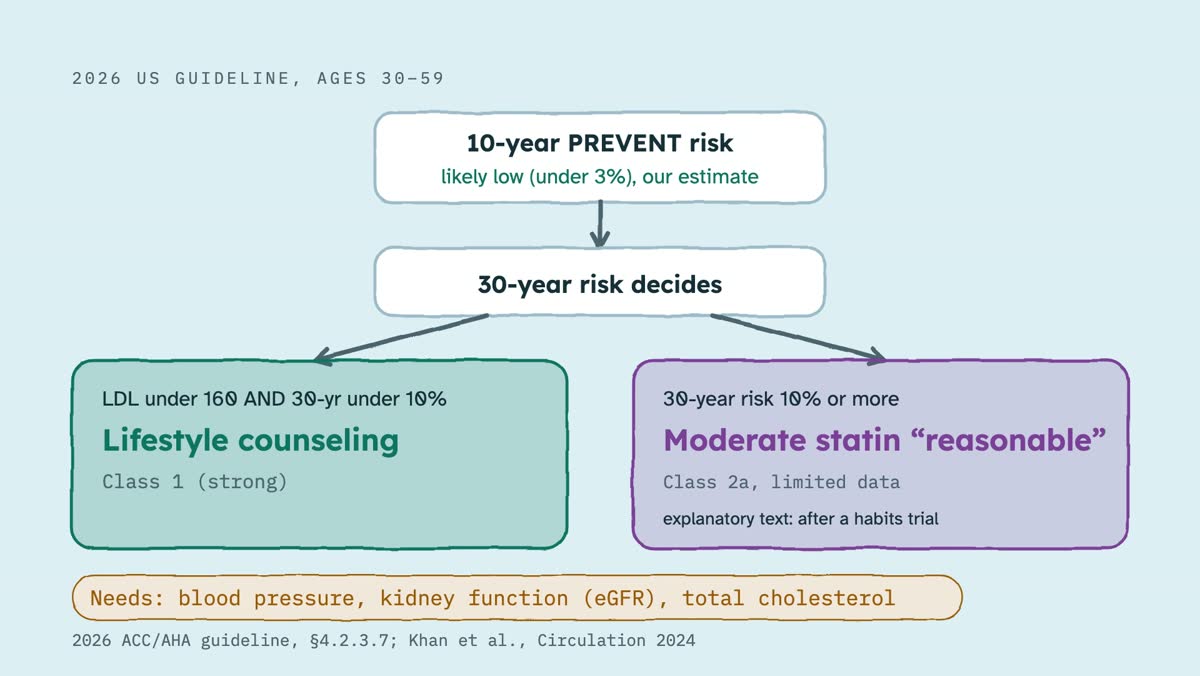
The U.S. guideline starts with a 10-year risk estimate. Our guess: a never-smoking man his age likely lands in the low band, under 3 percent, unless his blood pressure or kidney function is off. At low 10-year risk, the 30-year number decides. If LDL is under 160 and 30-year risk is under 10 percent, the guideline recommends lifestyle counseling. At 10 percent or more, a moderate-intensity statin is rated reasonable, on limited data, and the guideline's explanatory text puts it after a trial of healthier habits. And that 30-year number needs his blood pressure and kidney function, which we don't have.
European guidelines land in a similar place. At low risk, if LDL stays at 116 or higher despite lifestyle changes, the 2025 European update says a drug should be considered. And neither guideline family turns family history into an automatic trigger.
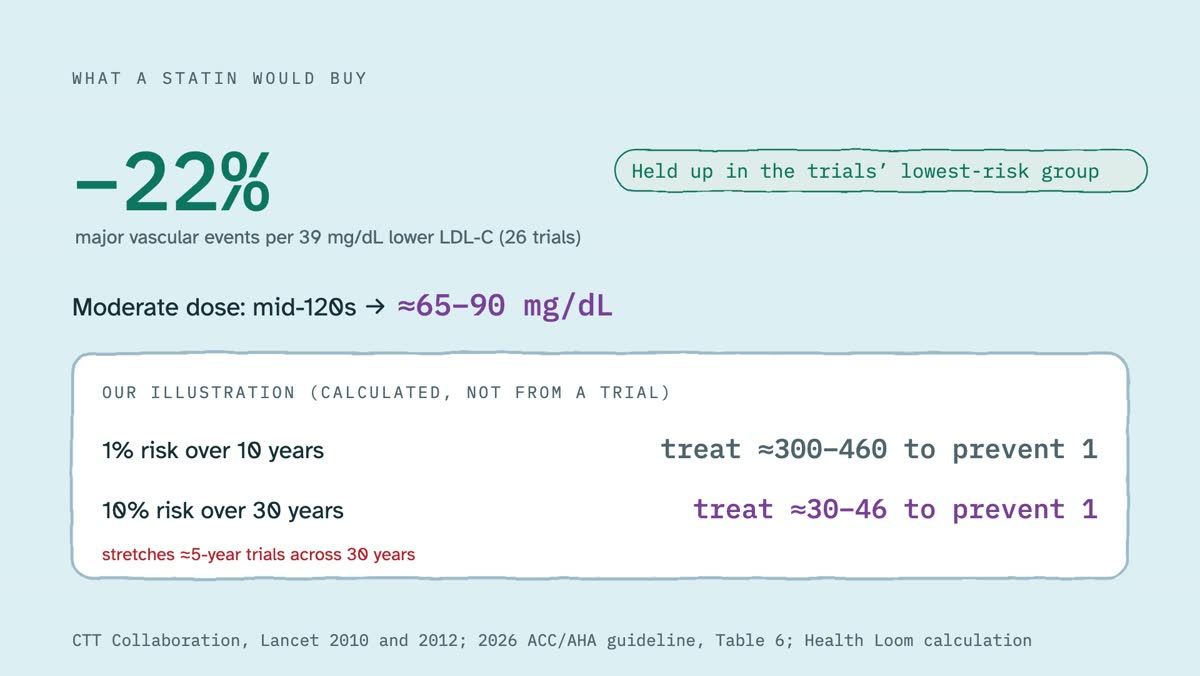
What would a statin buy? Across 26 trials, each 39-point drop in LDL cut major vascular events by about 22 percent, and the relative benefit held up even in the trials' lowest-risk group. A moderate dose would take an LDL in the mid-120s to roughly 65 to 90. But absolute benefit depends on baseline risk. In our own illustration, at a 1 percent 10-year risk, roughly 300 to 460 people would need ten years of treatment to prevent one event. At a 10 percent 30-year risk, it's about 30 to 46, though that stretches five-year trials across three decades.
And the harms? In blinded trials, muscle symptoms were reported by 27.1 percent of people on a statin and 26.6 percent on placebo, so most aren't caused by the drug. Moderate-intensity statins raised new diabetes by about 10 percent in relative terms, and most new cases were in people whose blood sugar was already near the diabetes line. And two items on the guideline's list of factors linked to muscle symptoms, low body weight and vigorous exercise, may apply to someone this lean and active.
What diet can do
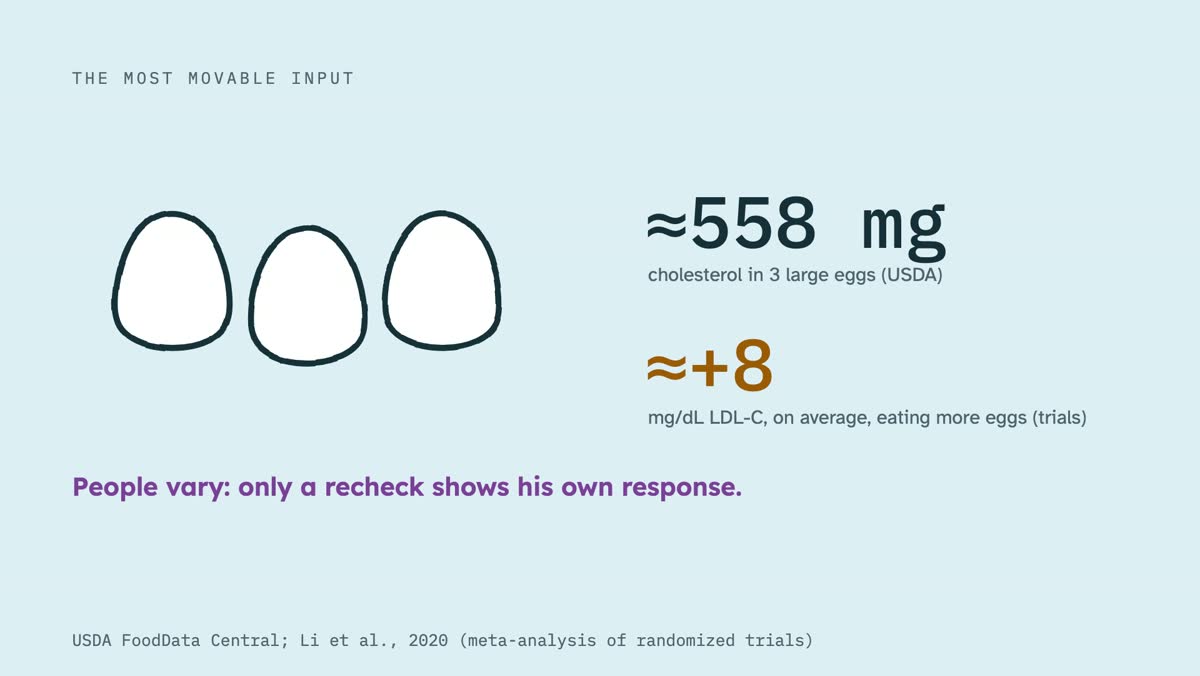
His menu offers one specific lever: three large eggs a day, about 558 milligrams of cholesterol. In randomized trials, eating more eggs raised LDL by about 8 points on average. People vary, so only a recheck after a change would show his own response.
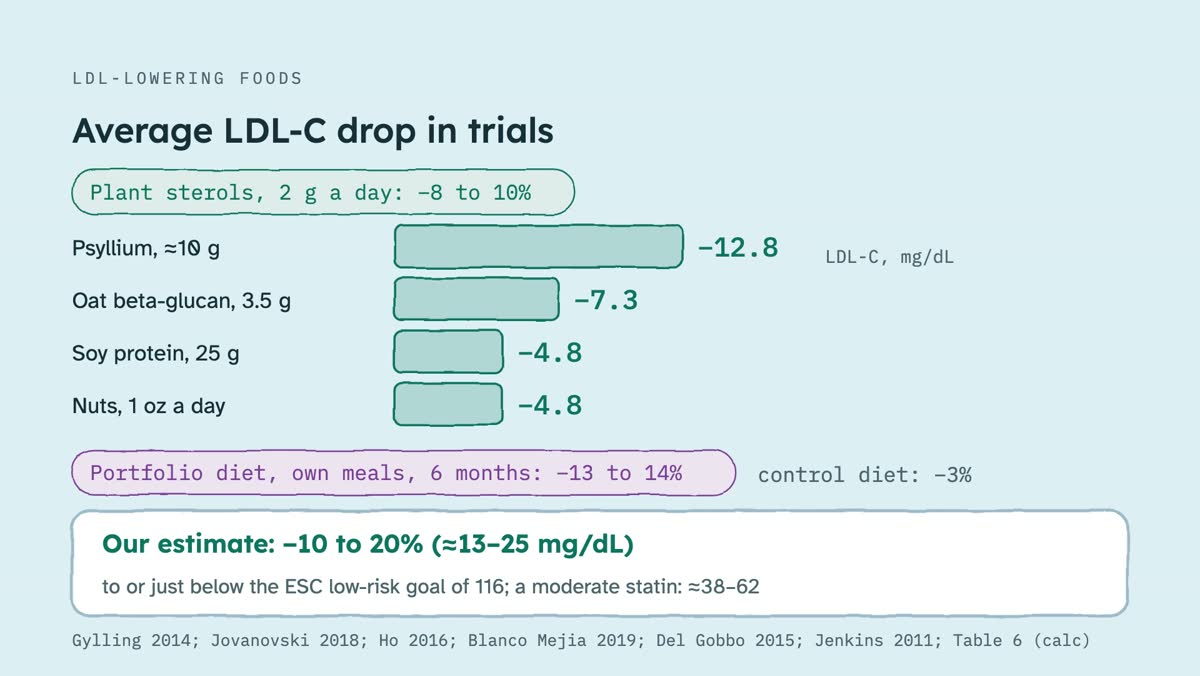
Adding LDL-lowering foods does more. Plant sterols lower LDL by 8 to 10 percent. About 10 grams of psyllium fiber takes off around 13 points, oat beta-glucan about 7, and soy protein and an ounce of nuts about 5 each. Combined as the Portfolio diet, people choosing their own meals lowered LDL by 13 to 14 percent over six months, against 3 percent on a control diet. Our estimate for him: a sustained 10 to 20 percent drop, roughly 13 to 25 points. That could bring him to or just below 116, Europe's goal for people at low risk, but it's well short of what a statin would do.
His supplements mostly don't help his LDL. Fish oil, if anything, nudges LDL up slightly, didn't significantly reduce major cardiovascular events in a large prevention trial, and carries a small atrial fibrillation signal. Vitamin D didn't prevent them either.
The calcium scan
A coronary calcium scan looks for calcified plaque. At 45, roughly a quarter to a third of White men have any calcium. East Asian ancestry tends to lower those odds, and family history raises them. So zero is the most likely result.
A positive score informs the most. At his age, almost any calcium puts him at or above the 75th percentile. In young adults in the CARDIA study, any calcium carried about five times the coronary risk. And the 2026 guideline's scan advice, written for people at intermediate and some borderline risk, not low risk, recommends cholesterol-lowering treatment when the score is above zero.
A zero is weaker reassurance at 45 than at 65, because young plaque often isn't calcified yet. Among symptomatic patients in their 40s with significant blockages on a CT angiogram, 34 percent had a calcium score of zero. A zero's warranty is short: in adults averaging 58, about three and a half years for White men. And the guideline says a zero shouldn't be used to put off treatment when there's a strong family history.
No completed trial has yet shown that calcium screening reduces heart attacks or deaths. The scan costs about 50 to 250 dollars, with about one millisievert of radiation. A polygenic risk score adds much less prediction than calcium does. And cheaper steps add precision: a fasting panel, a repeat apo B on the same lab's test, blood pressure, kidney function, and a blood sugar check when diabetes runs in the family.
Before you go
So, the real question isn't which marker is right. It's how much a modest, lifelong LDL exposure matters for someone whose father had a heart attack at about 40. A positive calcium scan would settle much of that. A zero would buy reassurance measured in years, not decades.
Three paths each fit some guideline text. One: keep the lifestyle, make diet changes, and recheck. Two: a set diet trial, then a statin if LDL stays high. Three: a moderate-intensity statin now, which fits the graded recommendation if 30-year risk is 10 percent or more, or, on thinner evidence, if a clinician judges the family history strong. Which fits depends on numbers nobody has calculated yet, and on how someone weighs a daily pill against a small, long-term drop in risk.
If you're in a similar spot, here are five questions to bring to a clinician. One: what are my 10- and 30-year PREVENT risks? Two: does my family history count as strong? Three: should we repeat a fasting panel with apo B, on the same lab, before deciding? Four: would a calcium scan change what we do, and what would we do with a zero? And five: should I check my blood sugar, given diabetes in the family?
Sources
52 sources cited in the video, in the order they come up.
Why the markers disagree
- 2026 ACC/AHA dyslipidemia guideline (with June and September 2026 corrections)
- Otvos et al. 2011, LDL-C vs NMR particle number (MESA)
- NLA 2024 consensus on ApoB (population percentiles)
- Lin et al. 2014 (reproduced LDL-P percentile tables)
- Labcorp LDL-P test page (example lab categories)
- Mora et al. 2014, discordance in the Women's Health Study
- Ference et al. 2019, triglyceride- and LDL-lowering variants per unit ApoB
- Richardson et al. 2020, multivariable Mendelian randomization
- Voight et al. 2012, HDL Mendelian randomization
Can good health offset LDL?
- Ference et al. 2012, lifelong lower LDL and coronary risk
- Ference et al. 2017, EAS consensus statement
- Fernández-Friera et al. 2017, PESA
- CCGC 2011, CRP Mendelian randomization
- Ridker et al. 2024, CRP, LDL and Lp(a) over 30 years
- Patel et al. 2021, Lp(a) in UK Biobank
- Fortuin-de Smidt et al. 2022, EPIC-CVD activity and cholesterol
- Lloyd-Jones et al. 2022, Life's Essential 8
- Domínguez et al. 2019, PESA sleep and plaque
- Norwitz et al. 2022, lean mass hyper-responder definition
- KETO-CTA longitudinal study retraction notice (2026)
His father's heart attack
- Lloyd-Jones et al. 2004, Framingham Offspring
- Nielsen et al. 2013, Danish registry
- Nordestgaard et al. 2013, EAS consensus on FH (Dutch criteria)
- Khera et al. 2019, sequencing in early heart attack
- Khan et al. 2024, PREVENT equations
The statin decision
- 2025 ESC/EAS focused update
- CTT Collaboration 2010, 26 trials
- CTT Collaboration 2012, people at low risk
- CTT Collaboration 2022, muscle symptoms
- CTT Collaboration 2024, statins and new diabetes
What diet can do
- USDA FoodData Central, whole egg
- Li et al. 2020, eggs and blood lipids
- Gylling et al. 2014, plant sterols and stanols
- Jovanovski et al. 2018, psyllium
- Ho et al. 2016, oat beta-glucan
- Blanco Mejia et al. 2019, soy protein
- Del Gobbo et al. 2015, tree nuts
- Jenkins et al. 2011, Portfolio diet
- Wang et al. 2023, omega-3 dose and lipids
- Manson et al. 2019, VITAL fish oil
- Gencer et al. 2021, omega-3 and atrial fibrillation
- Manson et al. 2019, VITAL vitamin D
The calcium scan
- Javaid et al. 2022, calcium percentiles at ages 30–45
- McClelland et al. 2006, MESA calcium by ancestry
- Dzaye et al. 2021, when calcium appears
- Carr et al. 2017, CARDIA calcium and later heart disease
- Mortensen et al. 2022, zero scores with obstructive disease
- Dzaye et al. 2021, warranty of a zero score
- DANCAVAS II, 2025
- Messenger et al. 2016, cardiac CT radiation dose
- Khan et al. 2023, calcium vs polygenic risk score
- Cao et al. 2018, comparing ApoB assays


